Multi-Marketplace E-Commerce Operating System
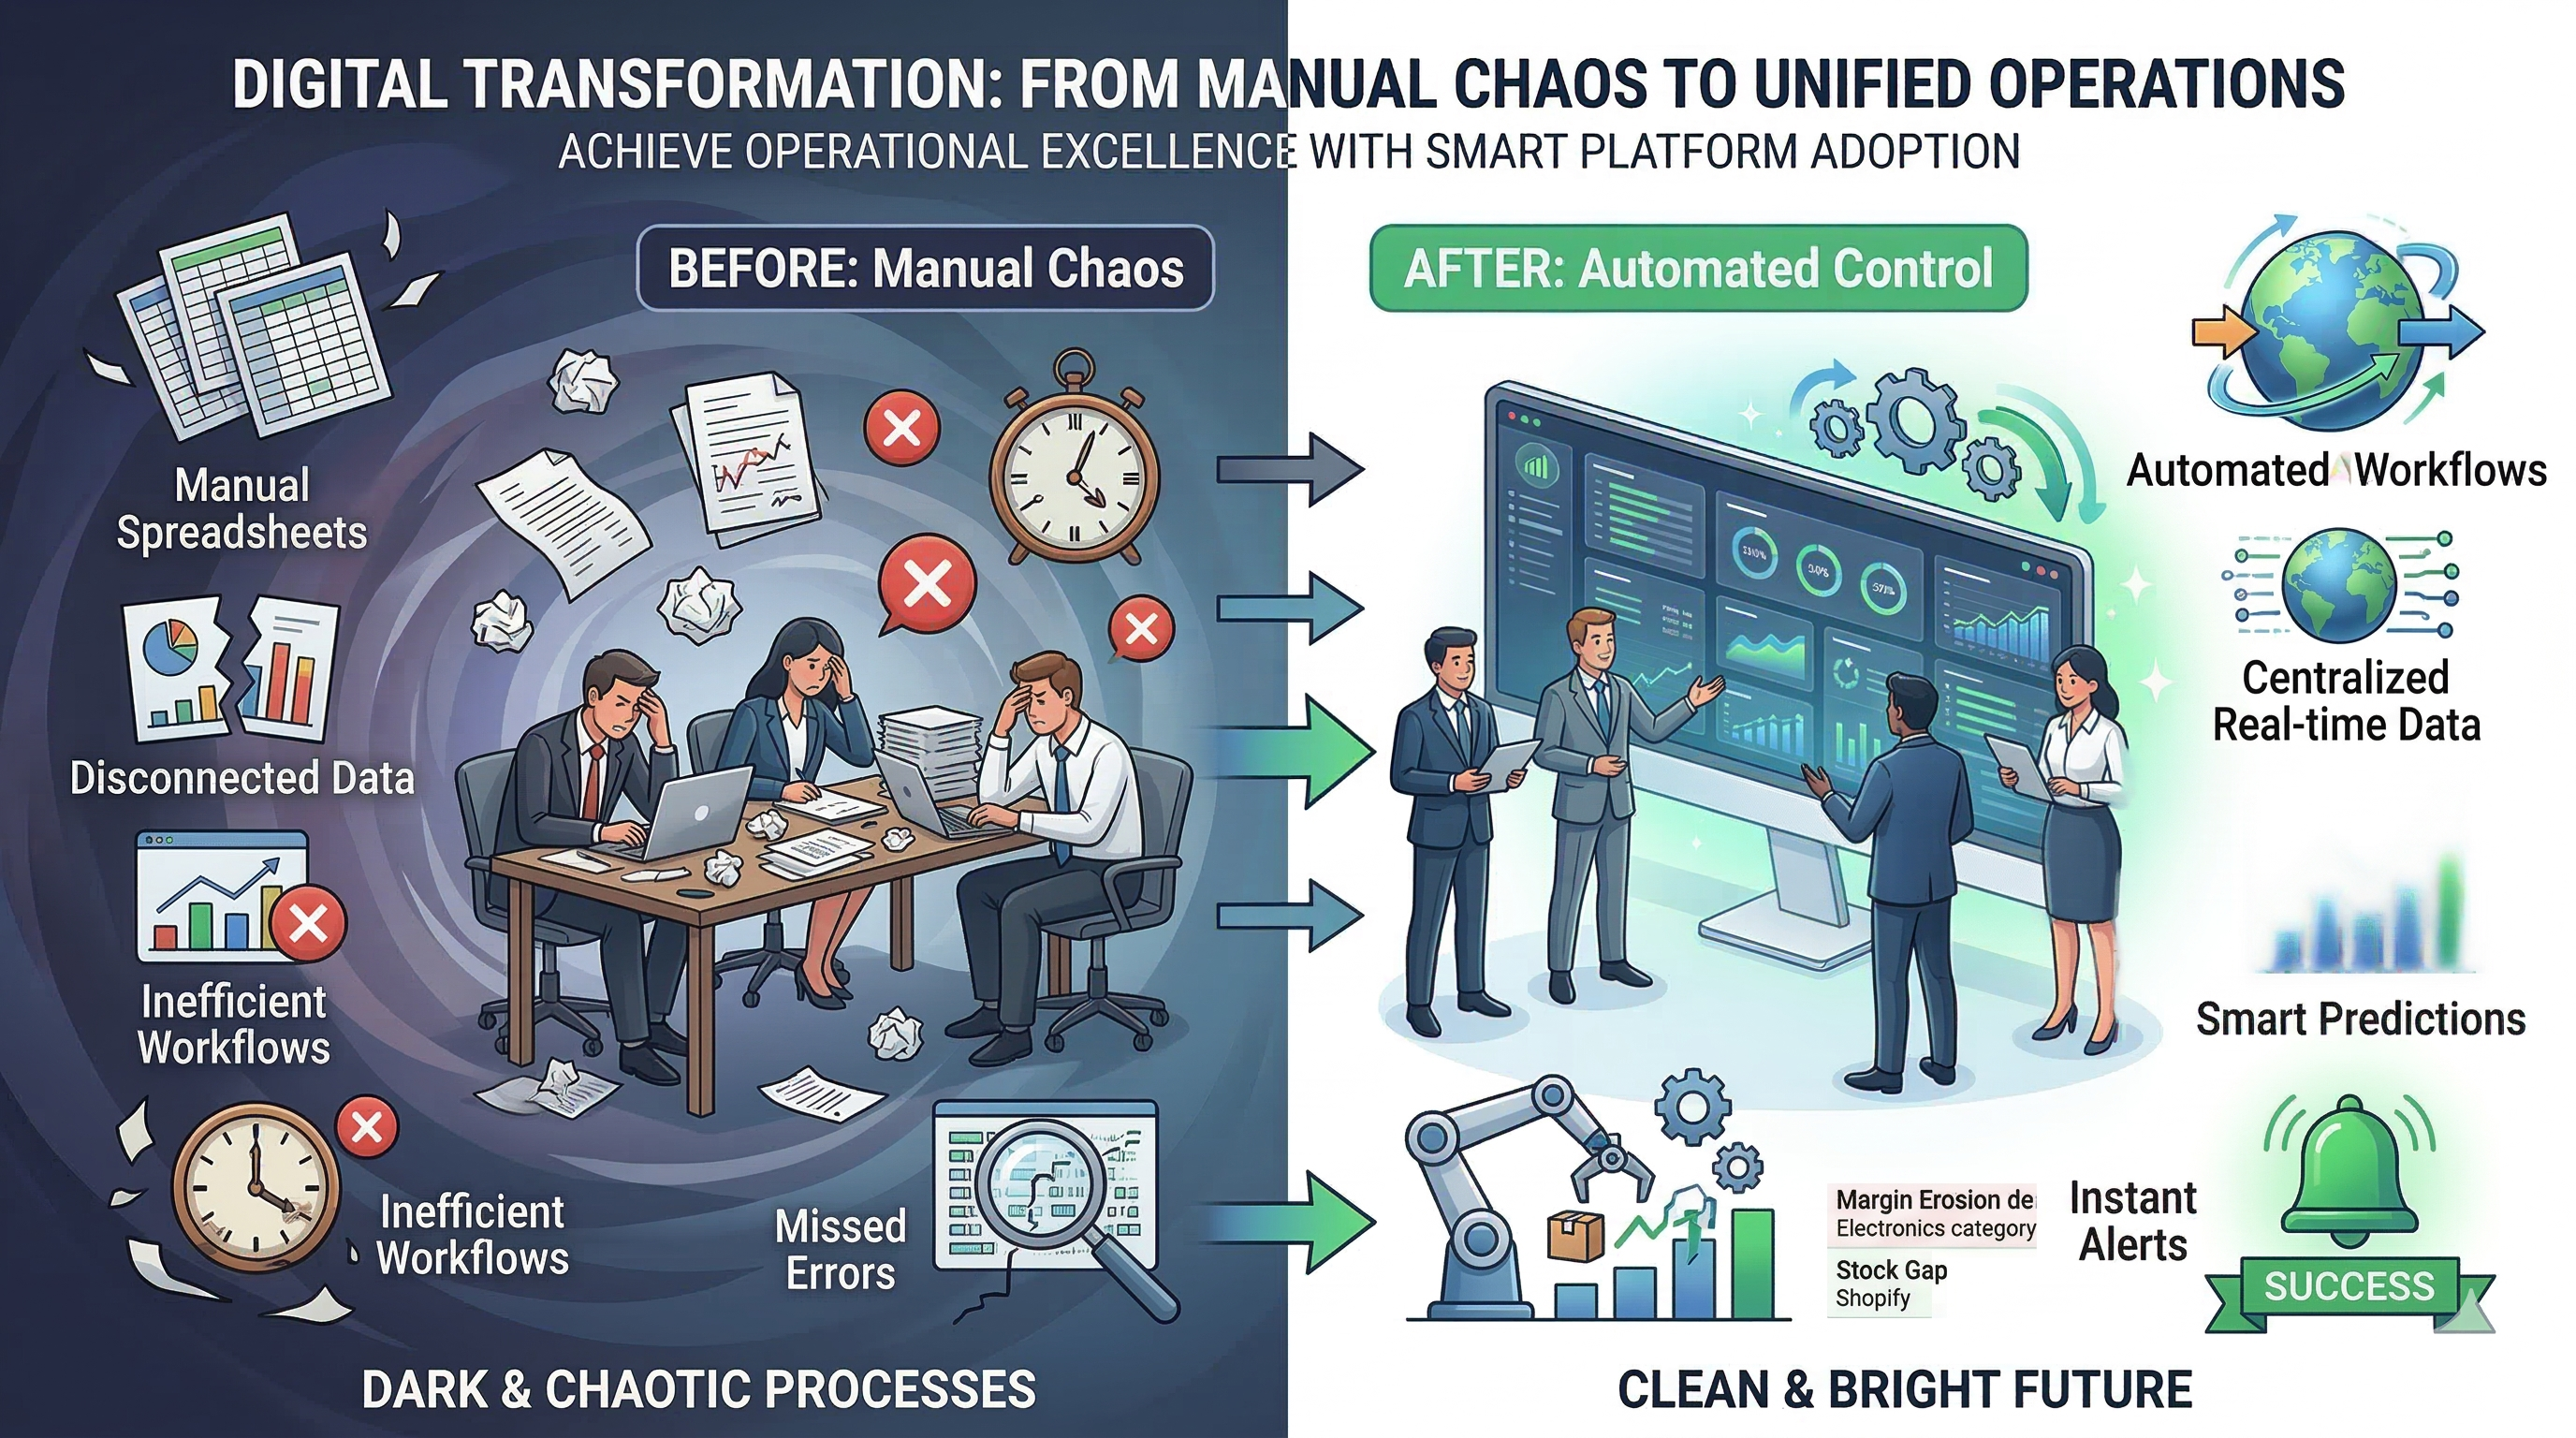
We built a unified operations platform that replaced 9 separate marketplace dashboards, eliminated manual data reconciliation, and automated issue detection for a global e-commerce company.
Dom Ventas
3 Months
Full-stack team
Full product design, engineering, and ongoing platform development.
“Managing nine marketplaces felt like running nine separate businesses. Every decision required logging into a different portal, downloading a different report, and hoping the data was still current.”
The Client
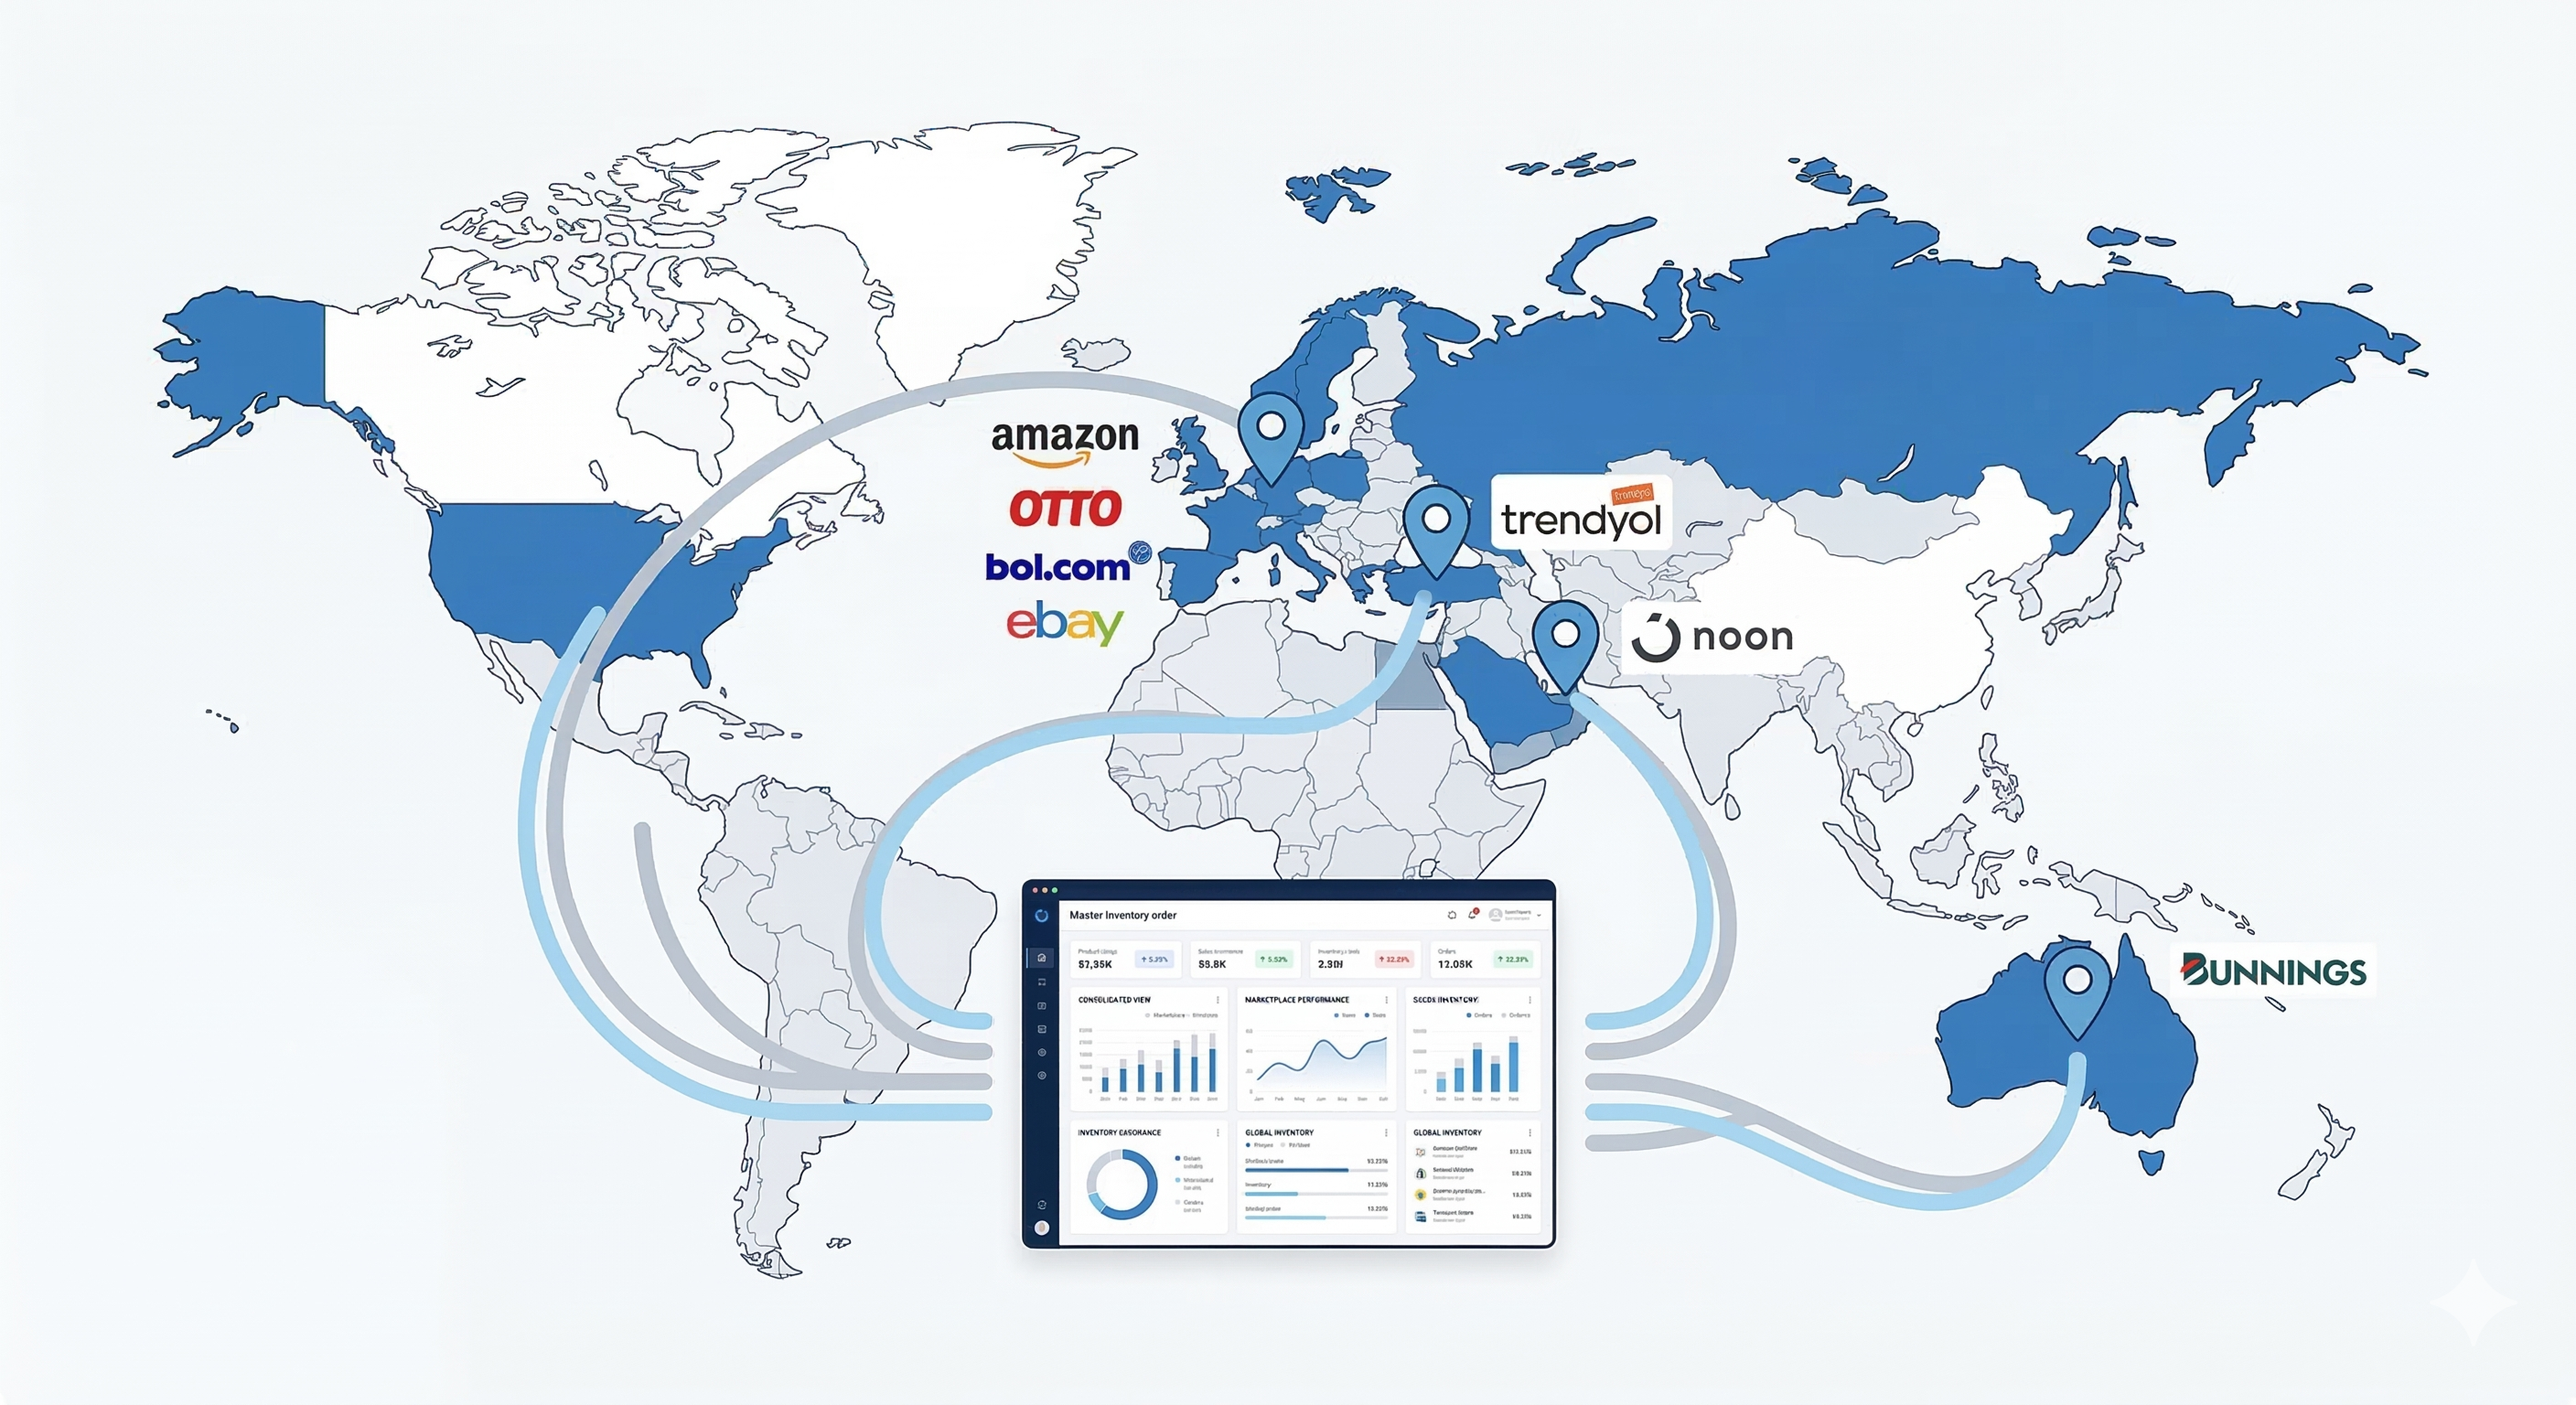
Dom Ventas is a multi-brand e-commerce company that sells consumer products across 9 global marketplaces spanning Europe, the Middle East, Turkey, and Australia. They manage thousands of SKUs across multiple brands, warehouses, and fulfillment centers — dealing with different currencies (EUR, USD, TRY, AED, AUD), different commission structures, and different operational rules per marketplace.
When they approached Broadwing Labs, they weren't looking for a simple dashboard. They needed an operating system for their entire e-commerce business — one that could replace the fragmented, manual processes that were holding them back from scaling.
The Problems
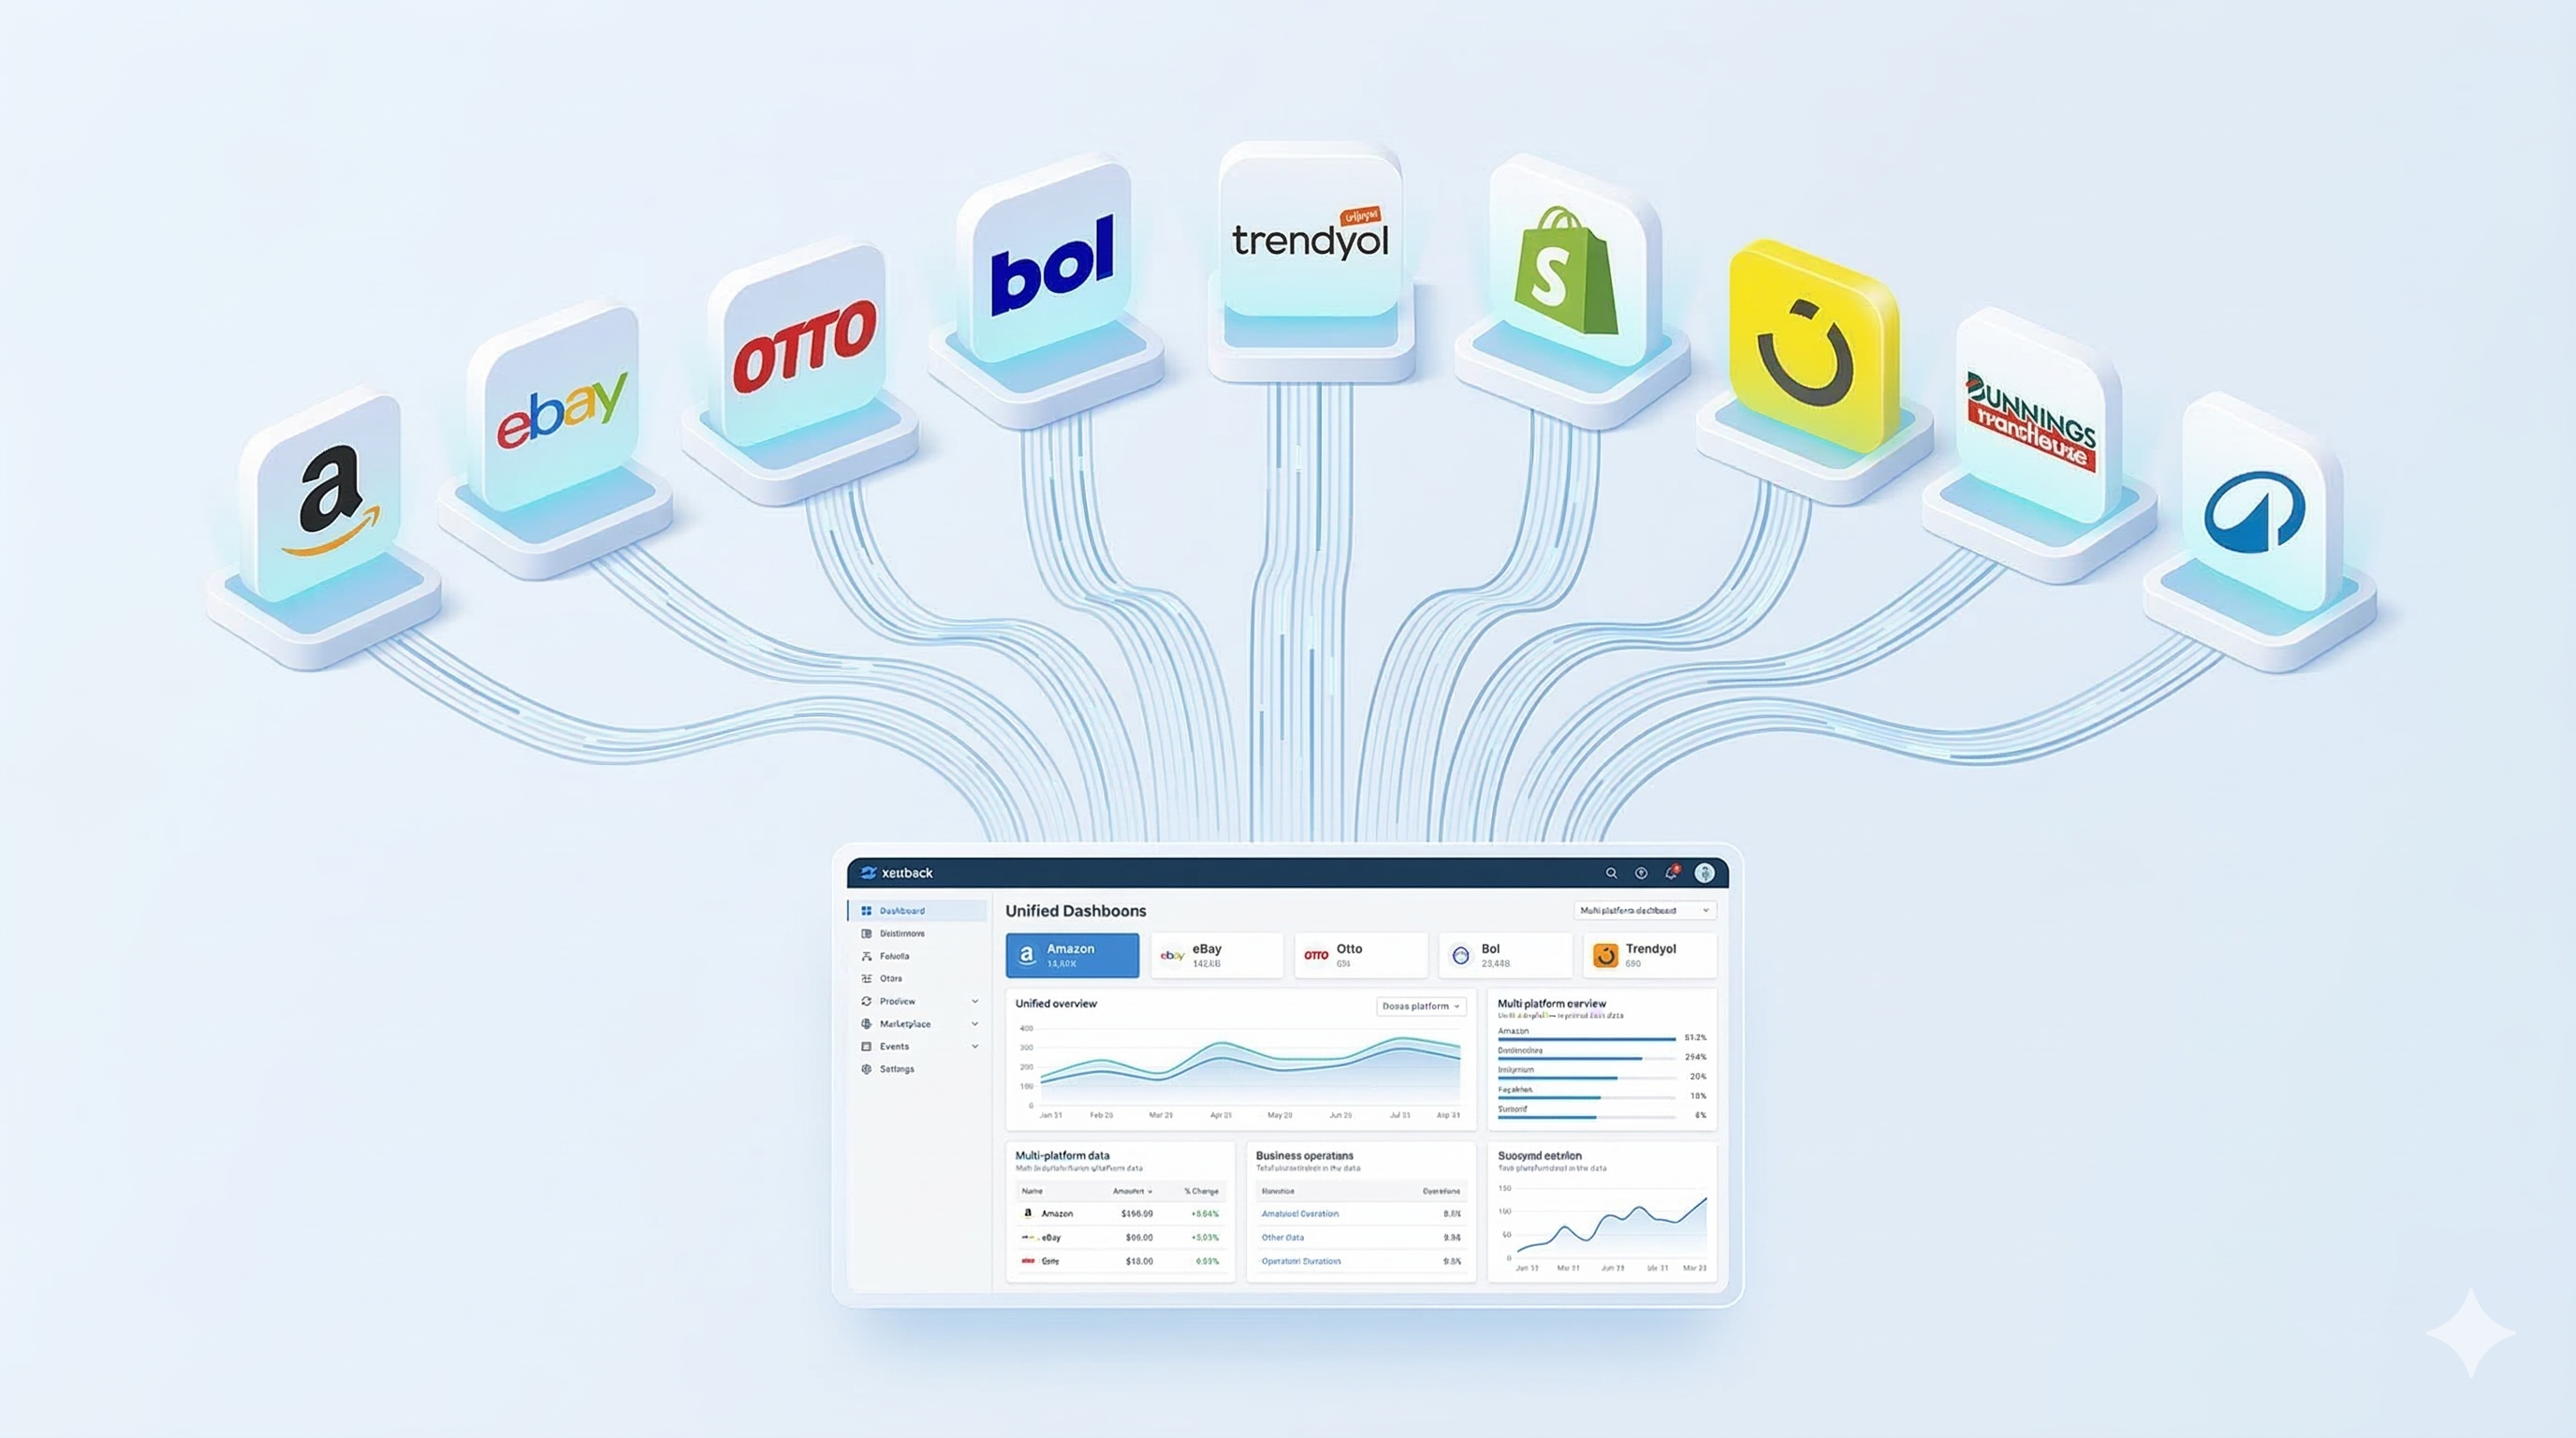
Nine Dashboards, Zero Unified Visibility
Every marketplace has its own seller portal: Amazon Seller Central, eBay Seller Hub, Otto Seller Portal, Bol.com Seller Dashboard, and so on. Dom Ventas' team had to log into nine separate systems every day to understand their business.
There was no single place to answer basic questions like:
- •“How did we perform across all channels today?”
- •“Which products are profitable and which are losing money?”
- •“Where is our inventory running low?”
Business decisions were made with stale, incomplete data — cobbled together from spreadsheets that took hours to compile and were outdated by the time they were finished.

Manual Payment Reconciliation Was Eating 15+ Hours Per Week
Every marketplace pays differently. Amazon sends settlement reports with line-item detail — but a single order with multiple items, returns, and partial refunds creates 5–10 separate financial transactions. Multiply that across nine marketplaces, each with different fee structures.
The finance team was manually matching payments to orders in spreadsheets. They couldn't answer confidently: “Are we being paid correctly?” Discrepancies went unnoticed for weeks.
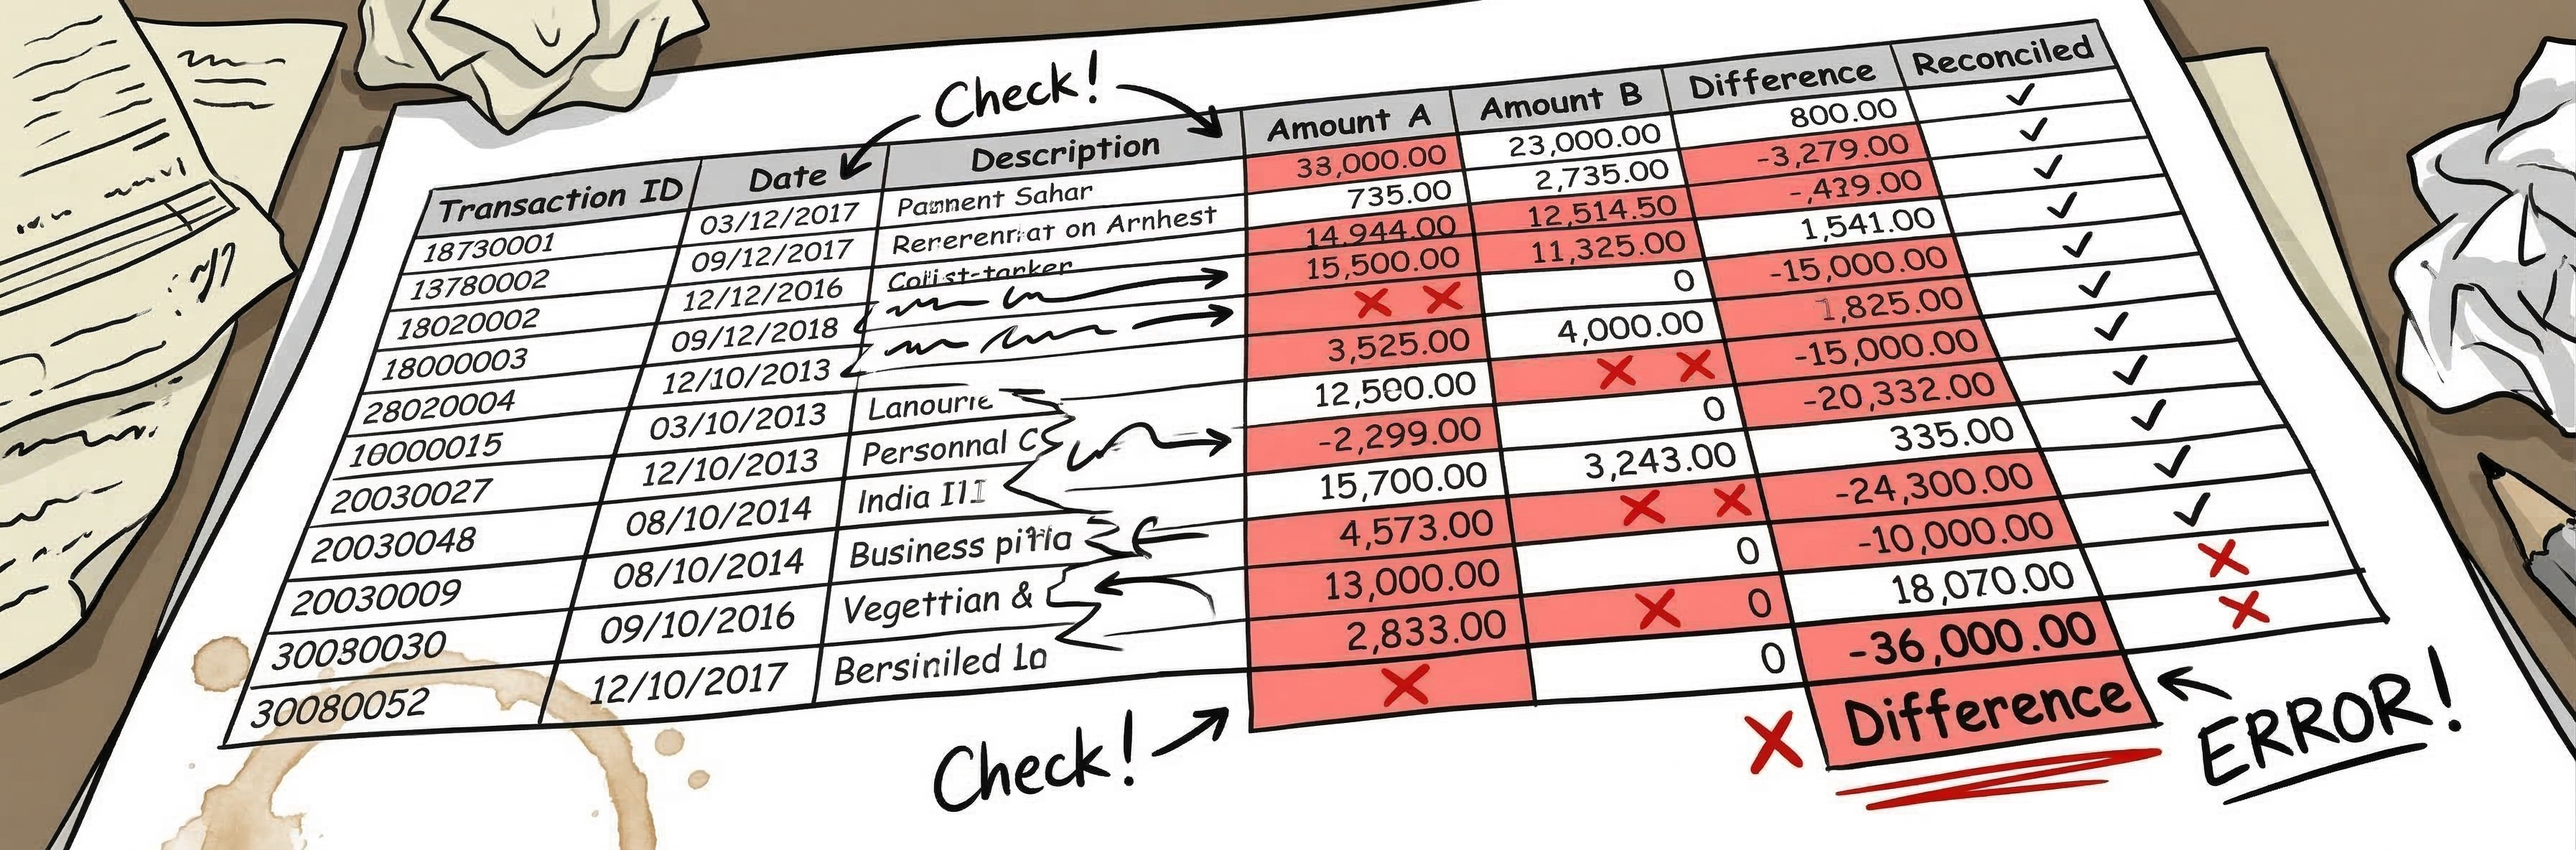
Before: Manual Reconciliation
Inventory Was Always Out of Sync
Dom Ventas operates multiple warehouses feeding multiple marketplaces. The problem: stock levels updated at different speeds across different platforms.
- Overselling: A product sells out on Amazon but still shows available on Otto — customer orders, can't fulfill, negative seller rating.
- Deadstock: Products sitting in one warehouse while another marketplace has demand but shows out-of-stock.
- No coverage visibility: Nobody could answer "How many days of stock do we have for Product X across all channels?"
Advertising Spend Was a Black Hole
Dom Ventas runs ad campaigns across Amazon (Sponsored Products, Sponsored Brands, Sponsored Display), Otto, and Noon — each with separate campaign management interfaces.
- •No unified ROAS view — can't compare ad efficiency across platforms
- •Thousands of keywords and targets across campaigns — impossible to optimize manually
- •ACOS drift — Ad Cost of Sales creeping above profitable thresholds without anyone noticing until the monthly review
- •Wasted spend on irrelevant search terms — no systematic negative keyword management
- •No connection between ad performance and product profitability
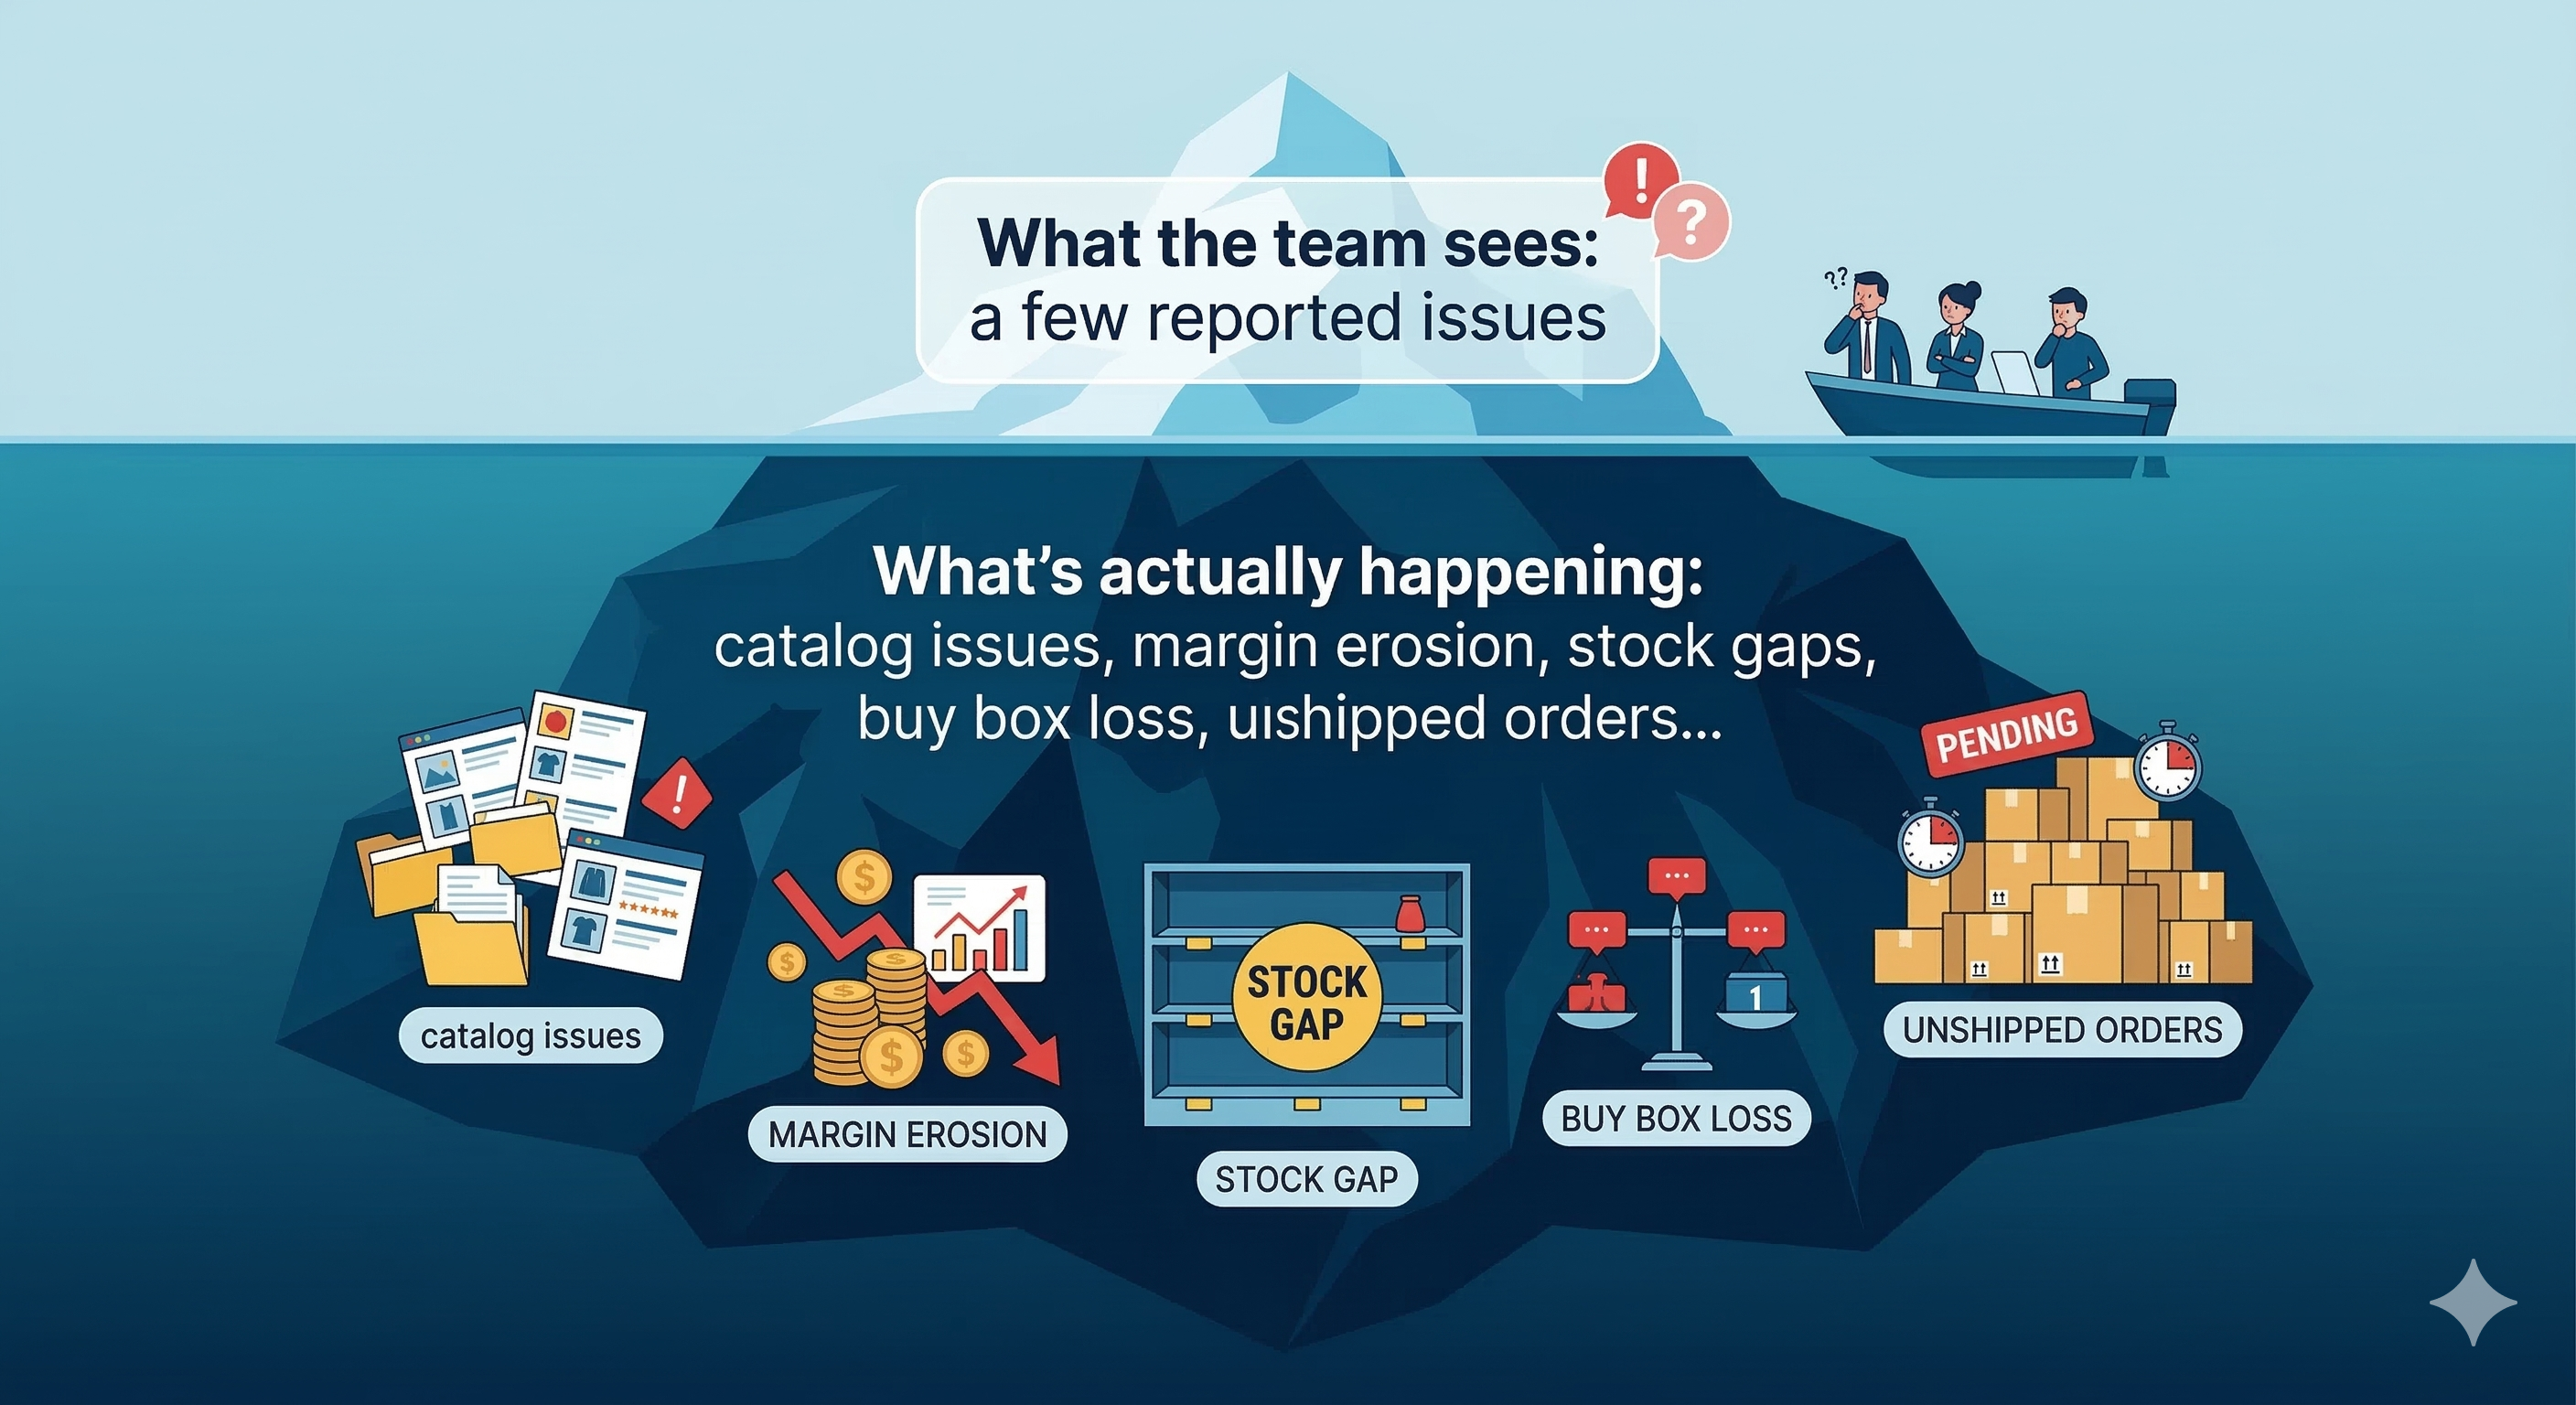
Operational Issues Piled Up Faster Than Humans Could Detect Them
With thousands of SKUs across 9 marketplaces, problems compound silently:
| Issue Type | What Happens | Business Impact |
|---|---|---|
| Catalog Quality | Missing images, wrong descriptions, incomplete A+ content | Lower conversion rates, suppressed listings |
| Buy Box Loss | Competitor wins the Buy Box on your listing | Up to 80% sales drop on that listing |
| Stock Coverage Gaps | Less than 60 days of inventory remaining | Stockouts — lost sales — damaged ranking |
| Margin Erosion | Profit drops below 15% after all fees and returns | Selling at a loss without knowing it |
| Unshipped Orders | Orders sitting unfulfilled past SLA | Marketplace penalties, account health risk |
| Missing Product Data | Products in orders not registered in the system | Can't track profitability or performance |
| FBA Health Issues | Stranded inventory, long-term storage fees | Hidden costs accumulating silently |
Dom Ventas' team was in reactive mode — discovering problems only after they'd already caused damage. There was no systematic way to detect, categorize, prioritize, and resolve issues proactively.
No Product-Level Intelligence
Dom Ventas couldn't answer critical questions about their most important products:
- •“What's the real margin on this SKU after marketplace fees, shipping, returns, and ad spend?”
- •“Are we winning the Buy Box? How often? What's the trend?”
- •“How does this product perform on Amazon vs. Otto vs. Bol?”
- •“Is our catalog listing quality good enough to compete?”
- •“What's the return rate, and how much is it costing us?”
Each answer required pulling data from multiple systems, converting currencies, and doing manual calculations. For thousands of SKUs, this was simply impossible.
Cost Data Was Scattered and Unreliable
A single SKU can have different costs depending on:
- •Which warehouse it's stored in (fulfillment costs differ)
- •Which currency the marketplace operates in (EUR, USD, TRY, AED, AUD)
- •Which vendor supplies it (same product, different suppliers at different prices)
- •When it was purchased (cost validity periods change over time)
Without accurate, time-specific cost data per warehouse and currency, every profitability calculation was wrong.
Our Approach
When we sat down to architect the solution, we established three principles:
01
One source of truth
All marketplace data flows into a single unified system
02
Automate detection
The system should find problems before humans do
03
Scale without headcount
Adding marketplace N+1 should not require hiring more people
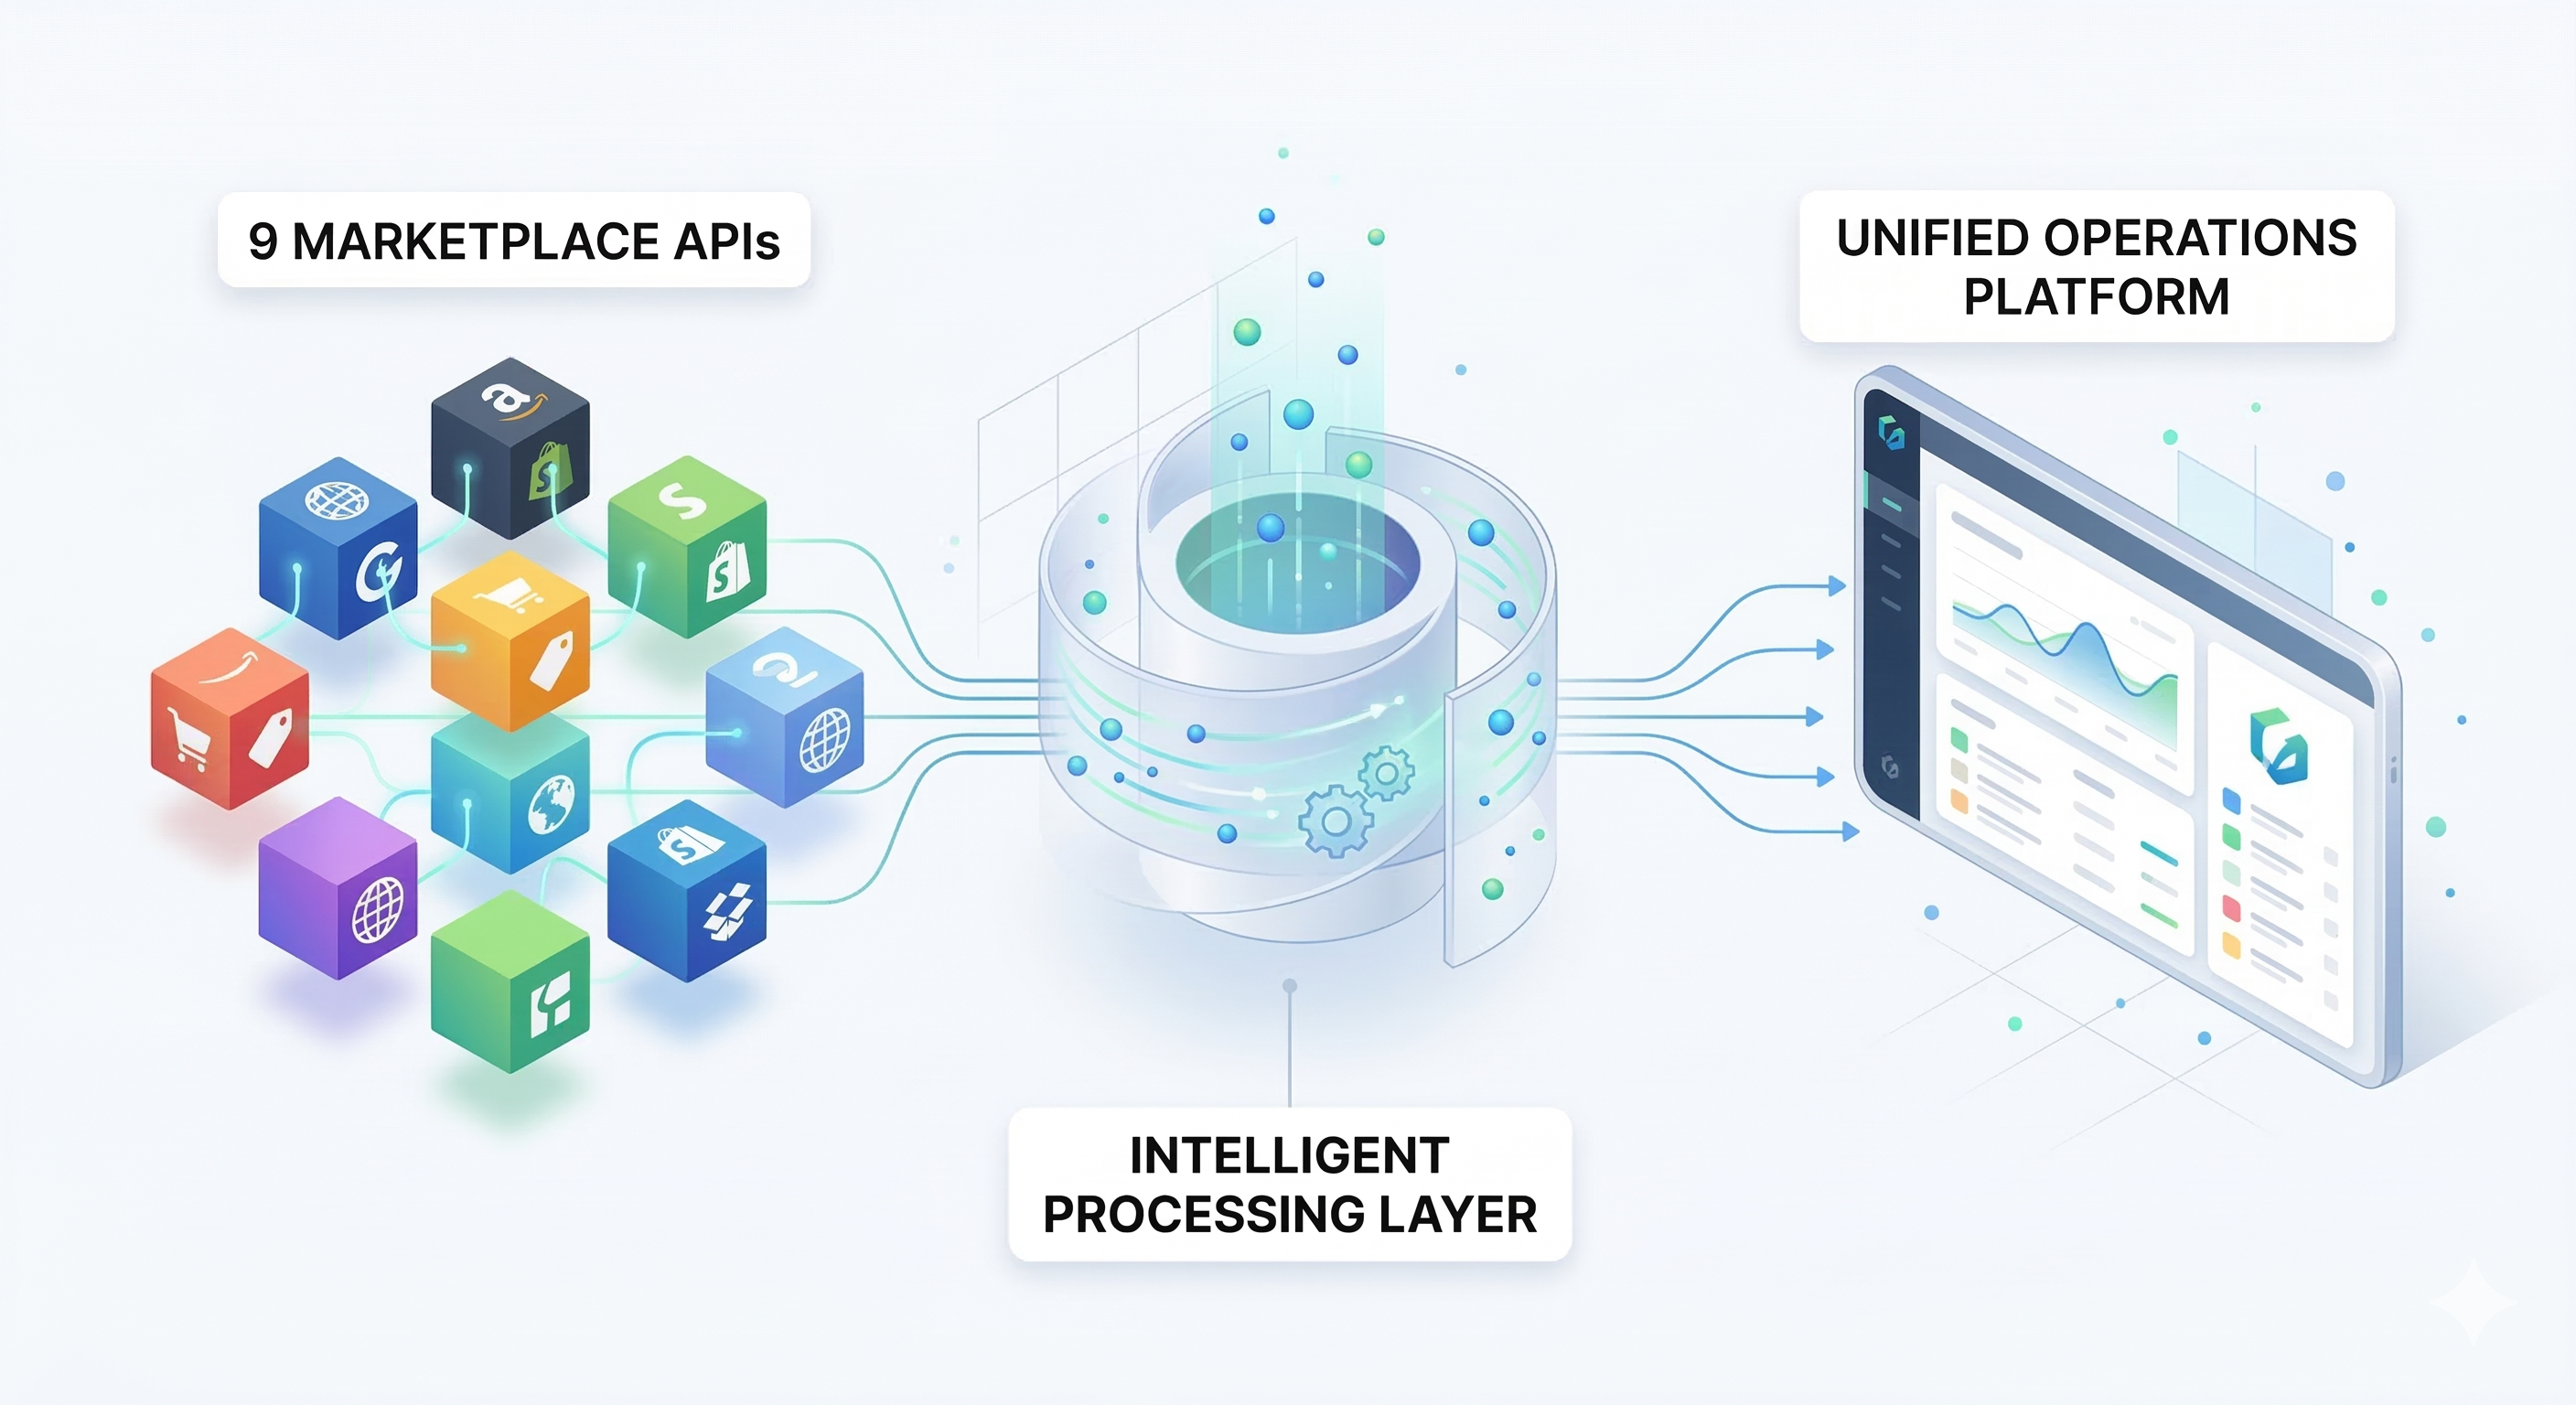
System Architecture
9 Marketplace APIs
Intelligent Processing
Unified Platform
Unified Data Ingestion
We built an ingestion layer that connects to all 9 marketplace APIs and normalizes the data into a single, consistent model. Every order, product, settlement, inventory update, and ad campaign — regardless of which marketplace it comes from — gets transformed into a unified format.
This was harder than it sounds. Each marketplace has:
- •Different APIs: REST, report-based, event-driven — some require request → poll → download workflows
- •Different authentication: OAuth, API keys, rotating tokens, marketplace-specific auth flows
- •Different rate limits: Amazon throttles aggressively, others are more lenient, each with different retry rules
- •Different data shapes: An "order" on Amazon looks completely different from an "order" on Trendyol
Resilient Background Processing
We designed the system to handle 156 automated data tasks running continuously — fetching orders, syncing inventory, downloading settlements, pulling ad performance data, and more.
Independent & retry-safe
If one task fails, it doesn't block others. It retries automatically.
Gap detection built in
The system automatically identifies missing data and fills the gaps.
Real-time where it matters
Amazon order events stream in instantly; others sync on optimized schedules.
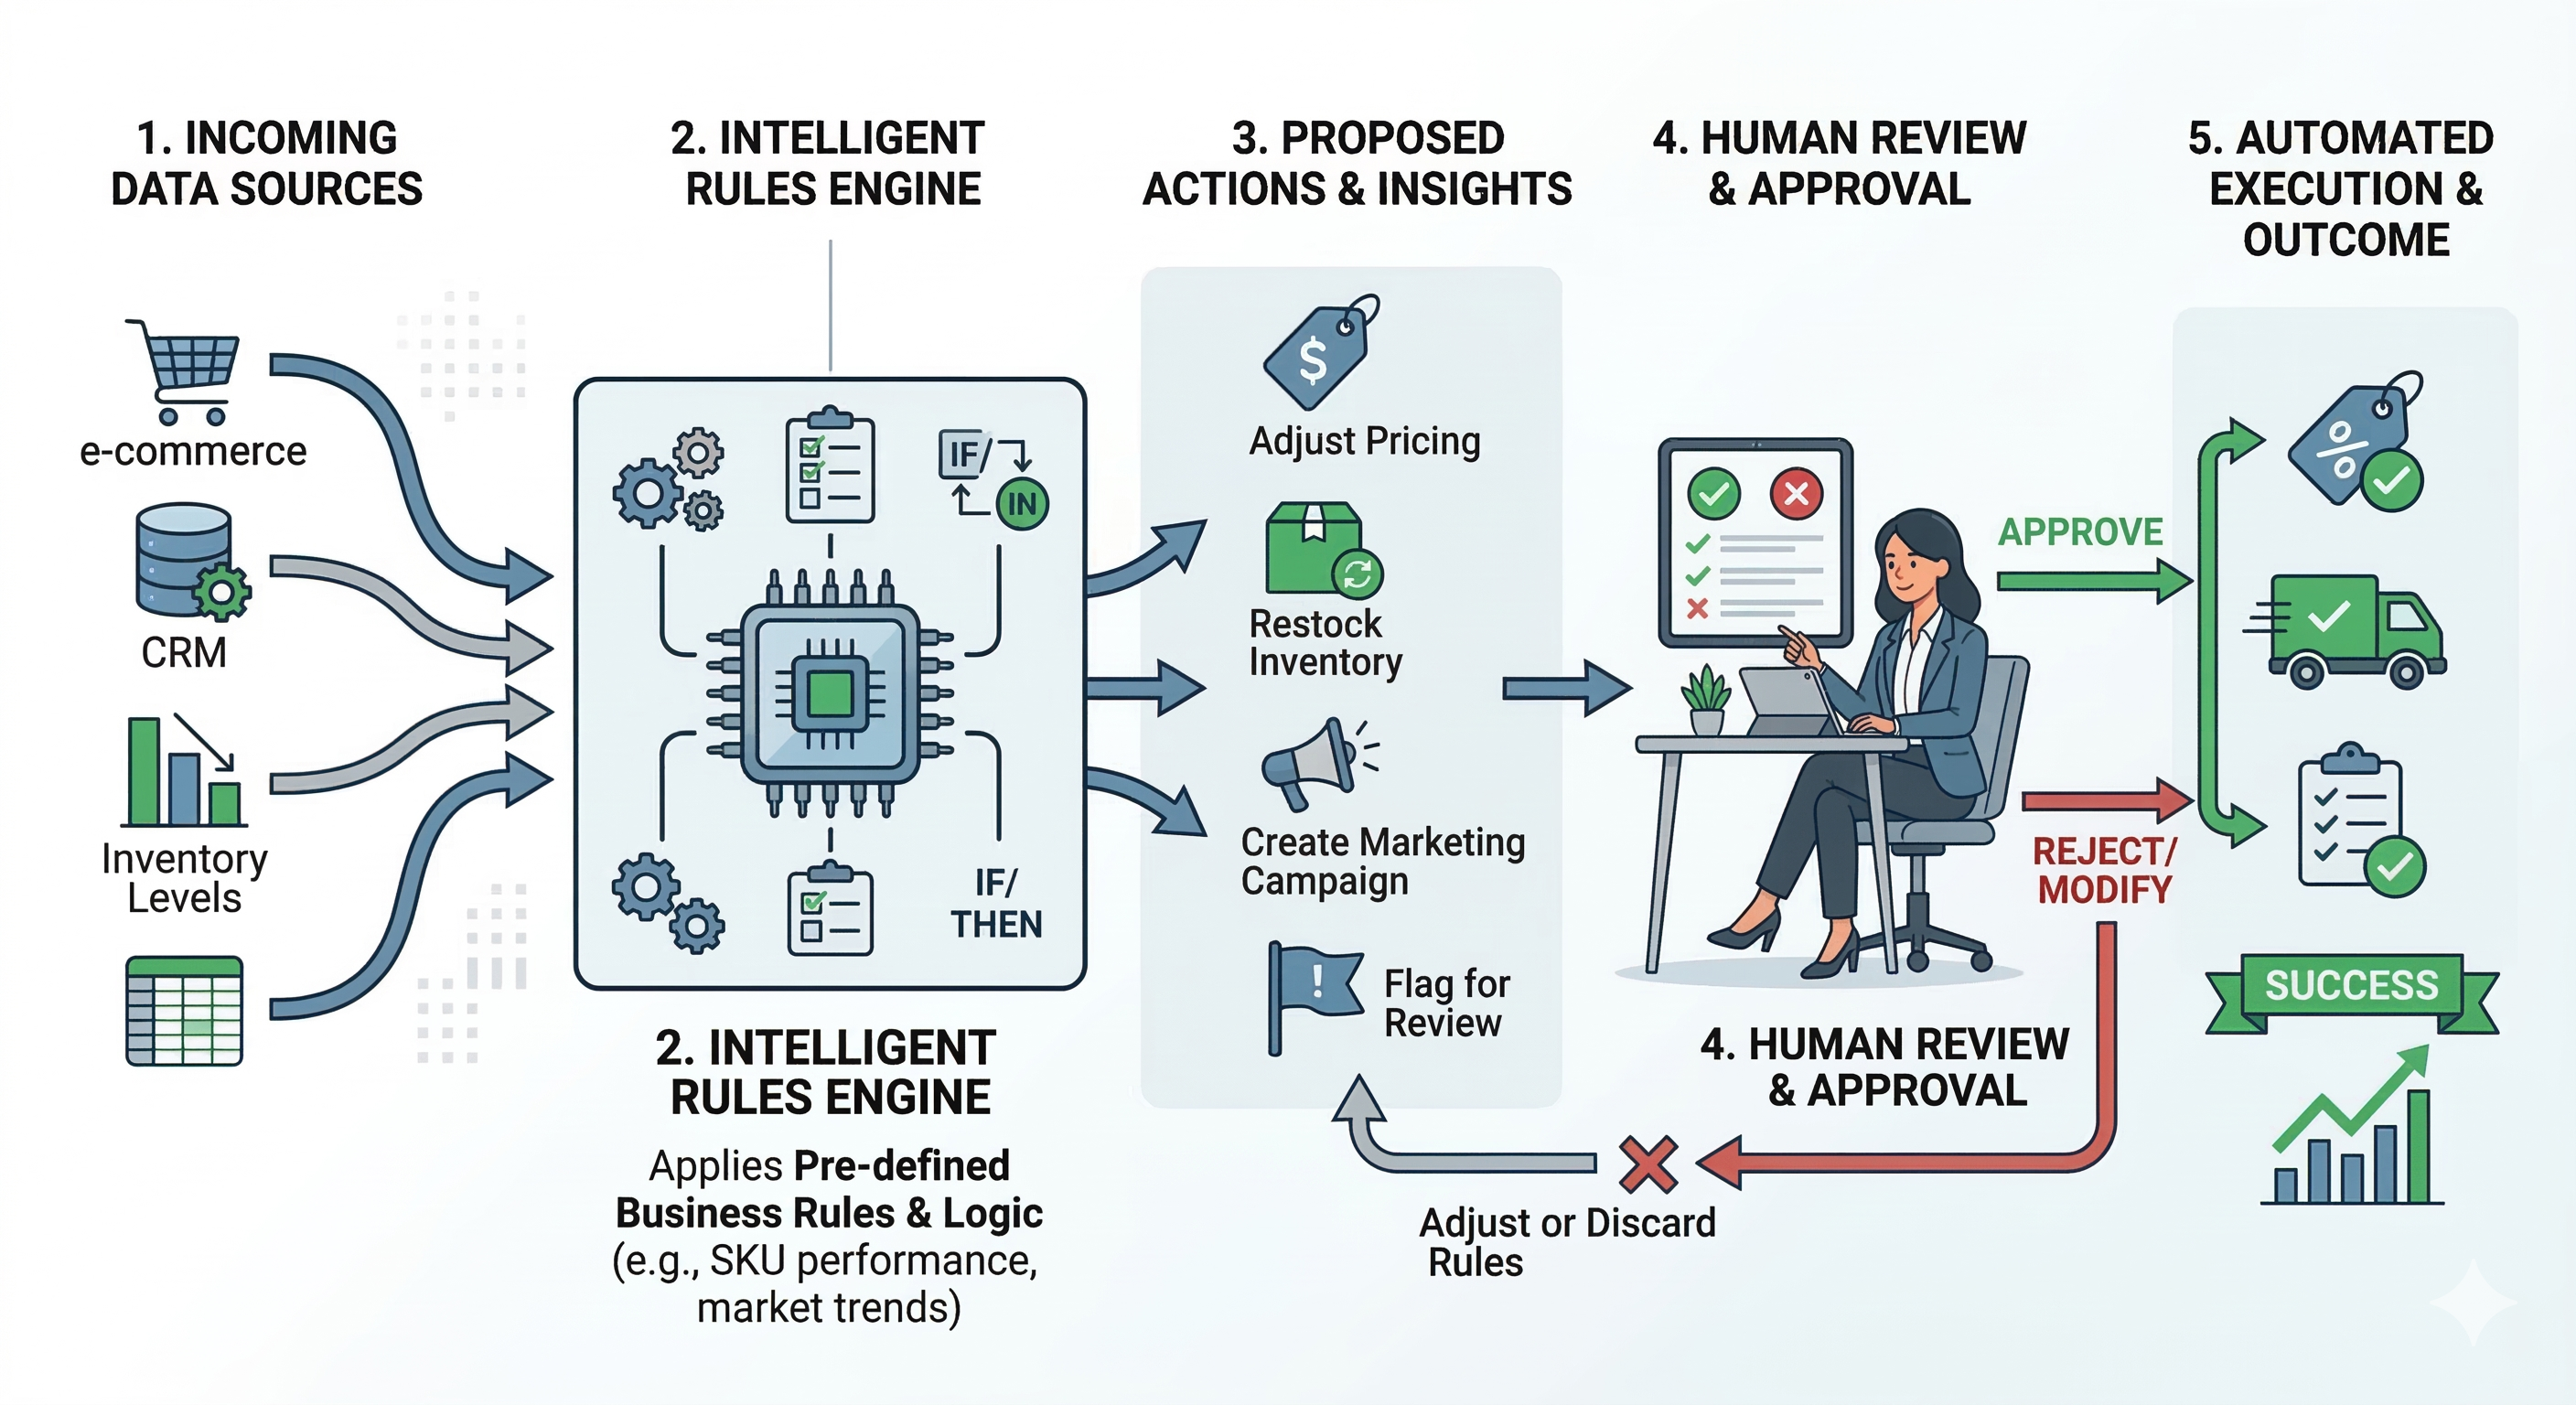
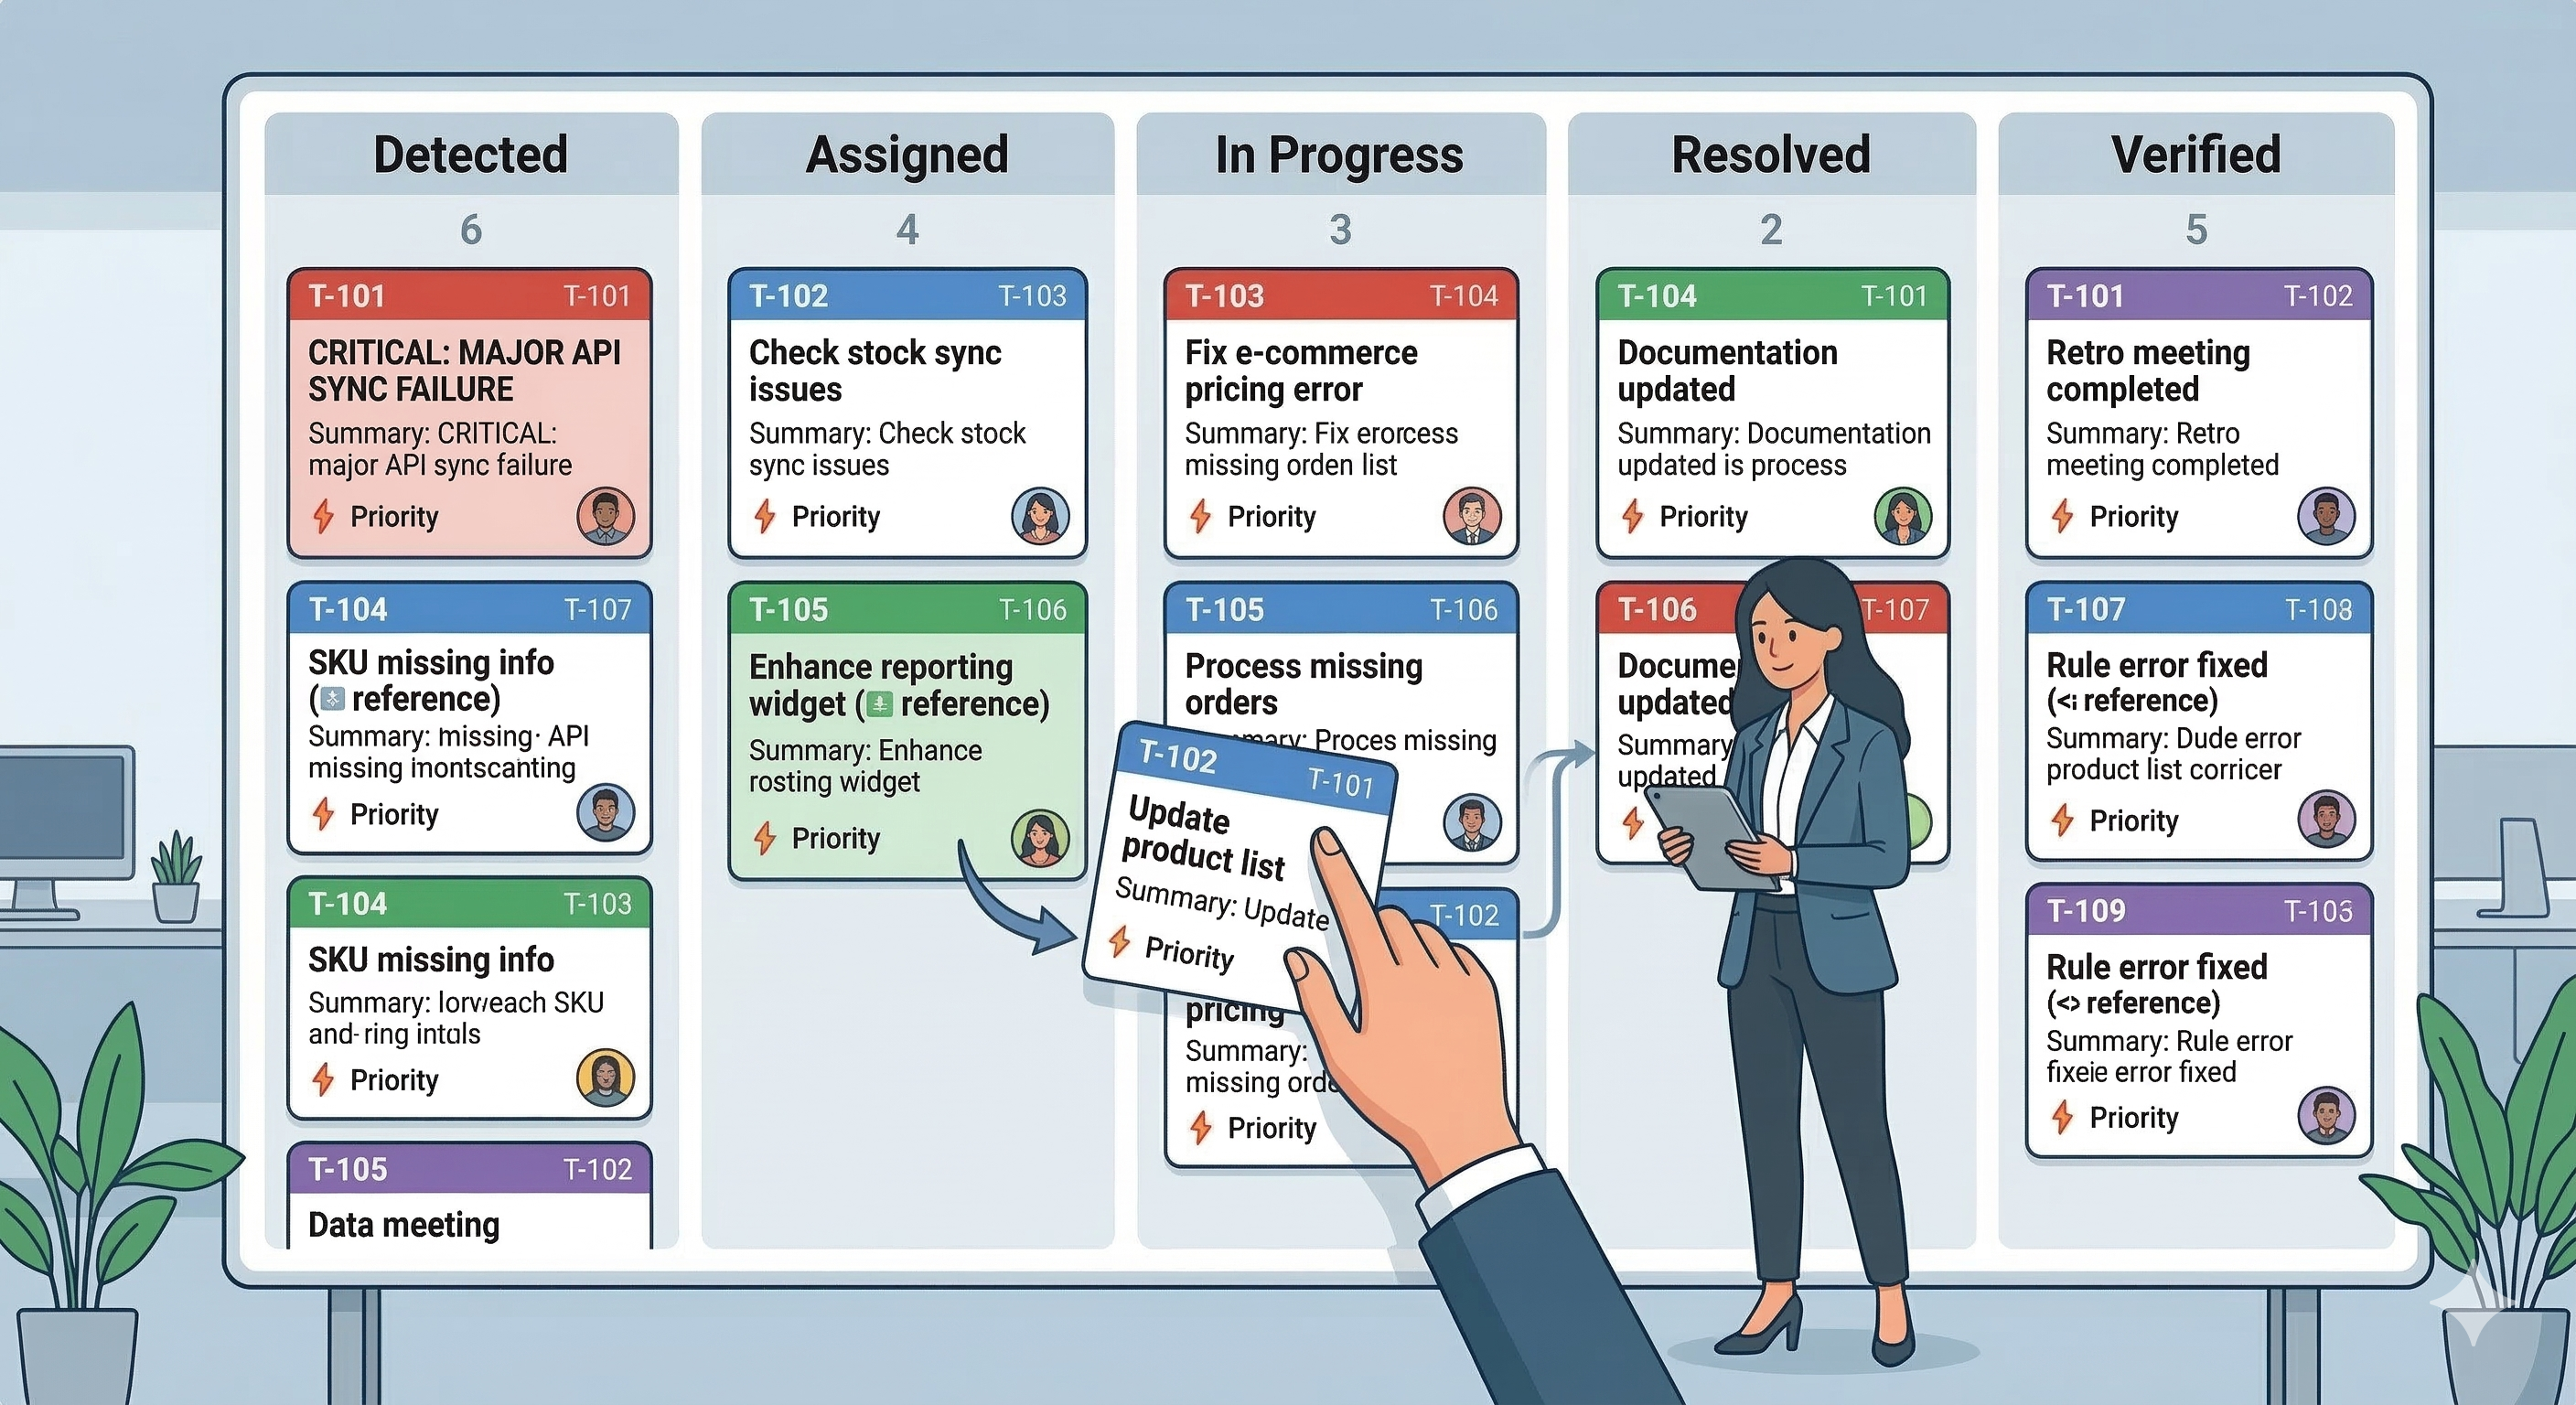
Automated Issue Detection
Instead of waiting for humans to spot problems, we built an analysis engine that continuously evaluates product performance across 21 distinct issue categories and automatically creates prioritized, actionable tickets for the operations team.
Automated Detection Flow
What We Built
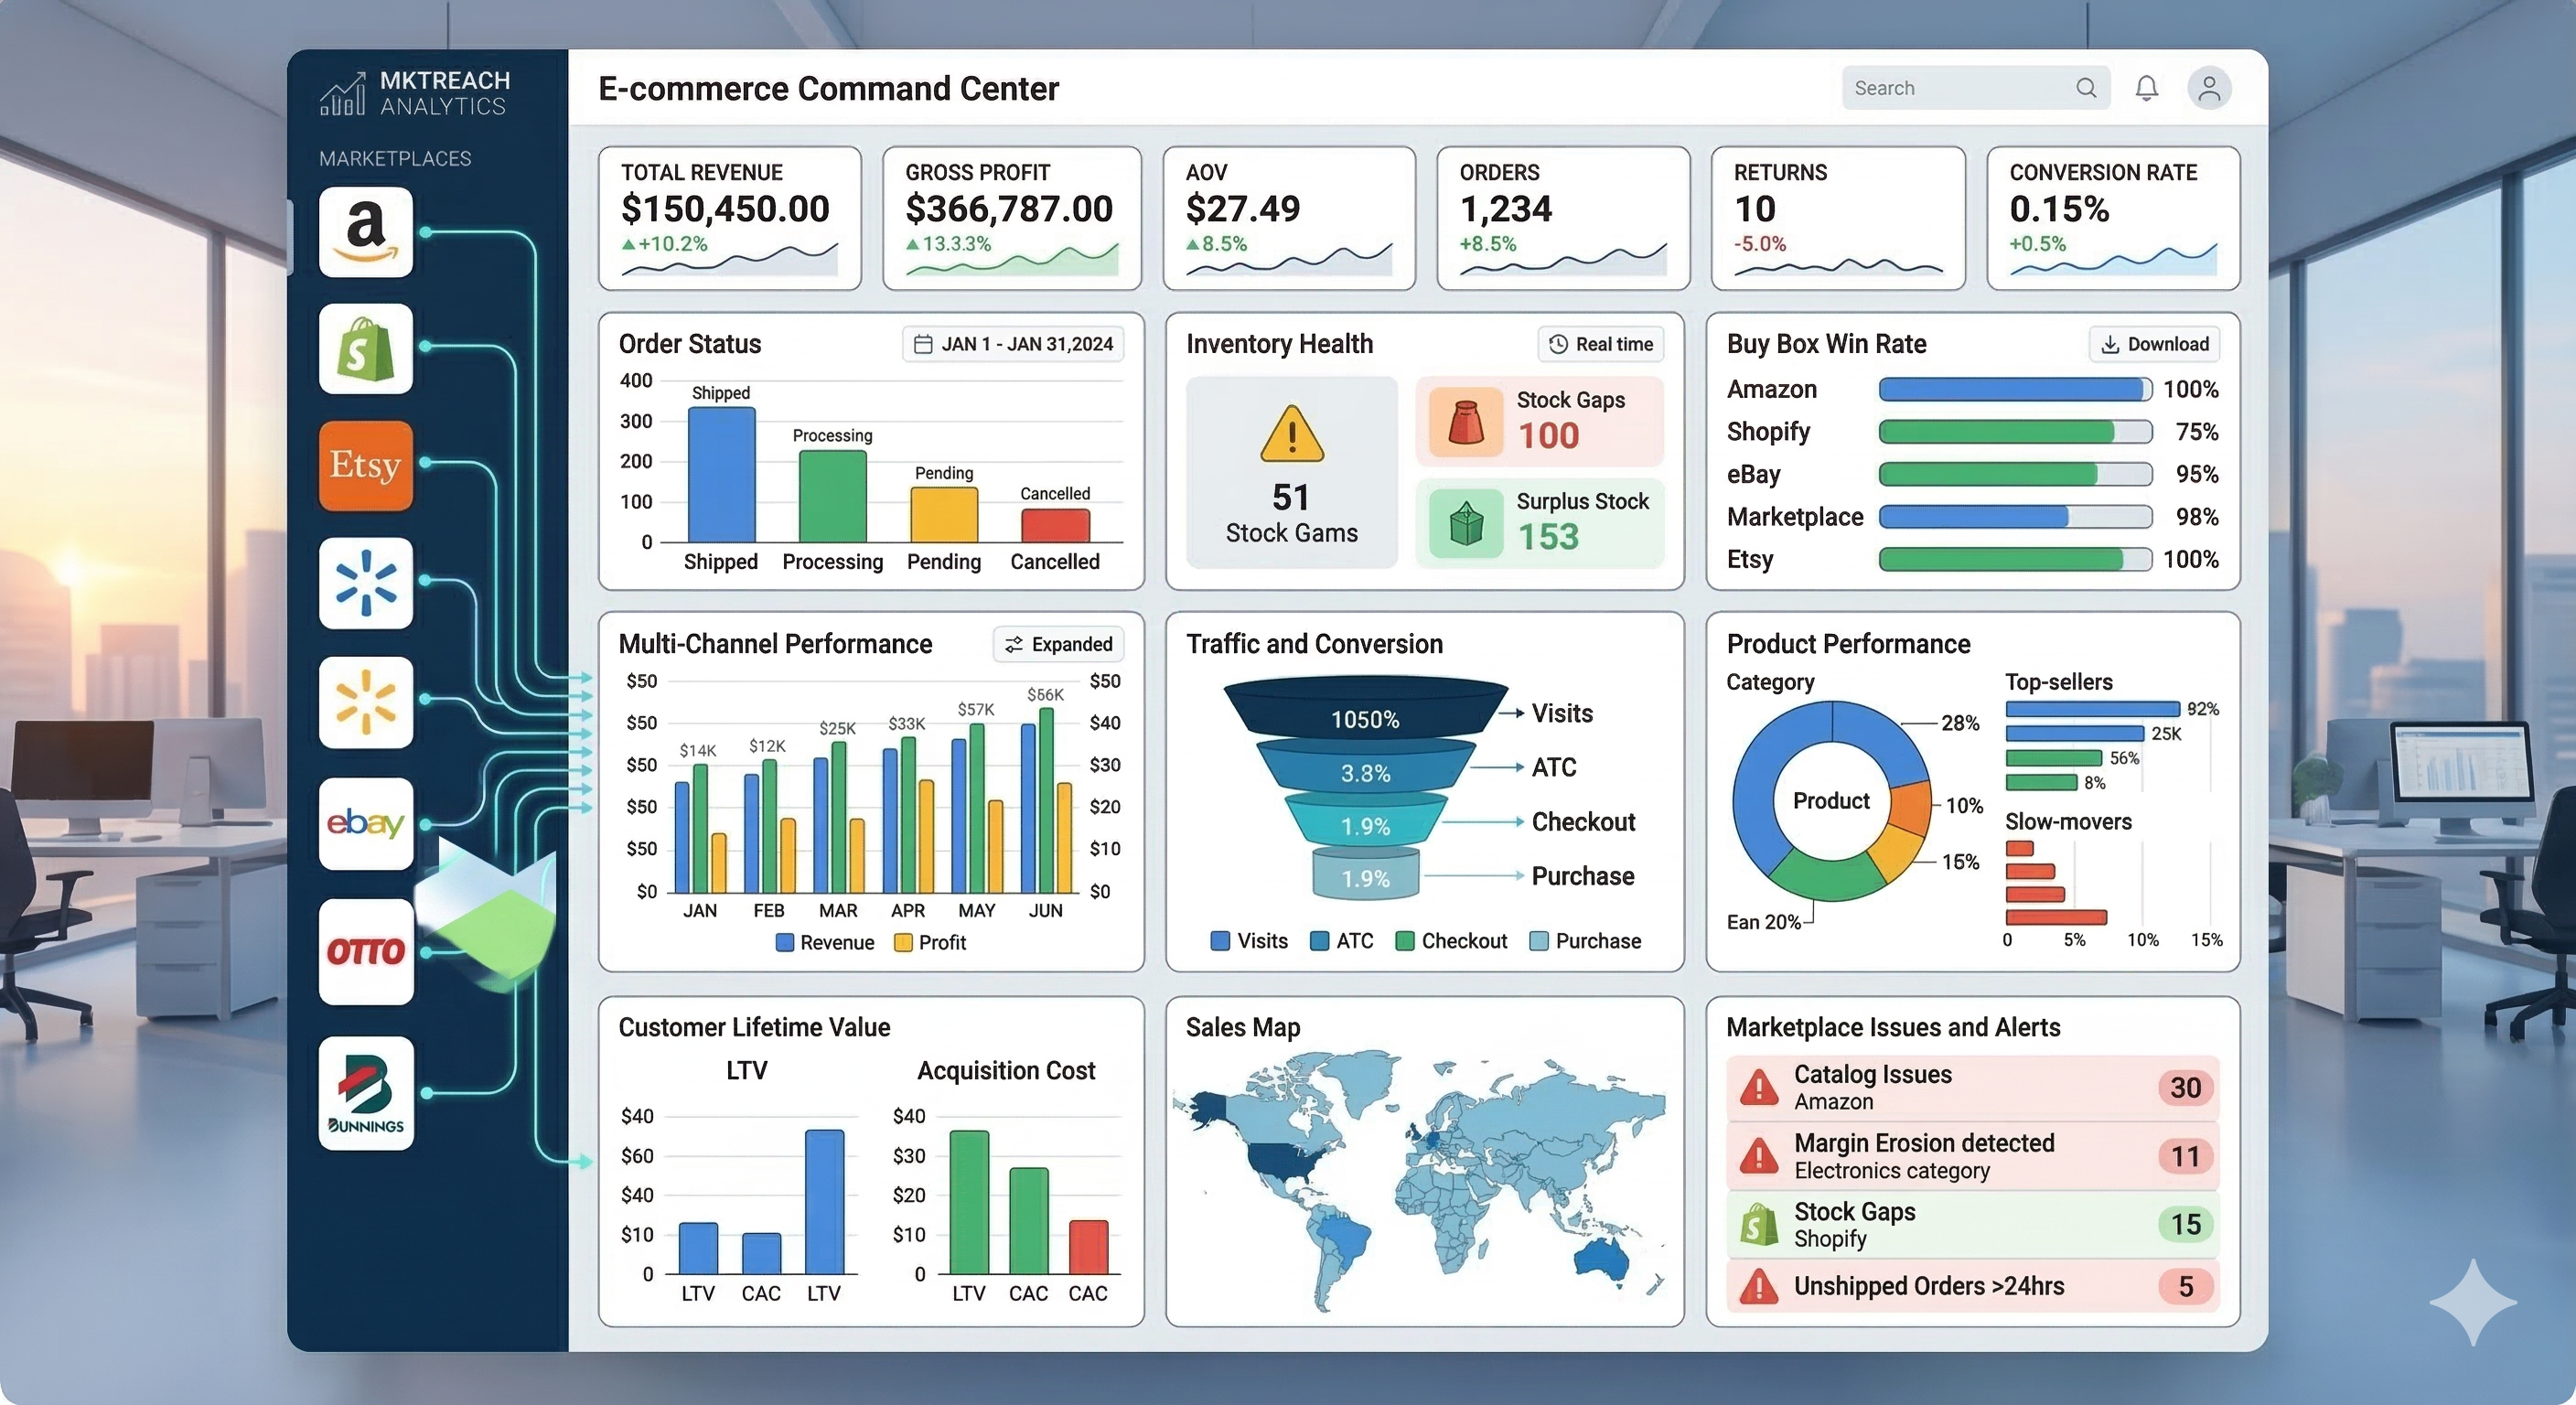
Unified Dashboard & Channel Reports
A single interface showing performance across all 9 marketplaces — sales, orders, revenue, returns, ad performance — with drill-down from channel level to marketplace level to individual SKU level.
Channel reports include competitive ranking, monthly run rate forecasting, and trend analysis so leadership can spot opportunities and problems without touching a spreadsheet.
Automated Payment Reconciliation
The system ingests settlement data from all marketplaces and matches every payment to the corresponding order — at the individual line-item level.
Per Order Item
Reconciliation
Discrepancies are flagged automatically. No more spreadsheet matching. No more missed discrepancies.
360° Focused SKU Analysis
For high-priority products, the platform provides deep intelligence across 7 dimensions:
Catalog Quality
IDQ Score, Images, A+ Content
Buy Box
Win Rate %, Competitor Pricing
Profitability
Real Margin After All Fees
Inventory Health
Stock Days, Warehouse Distribution
Sales Velocity
Units/Day, Revenue Trends
Return Rate
Return %, Cost Impact
Ad Performance
ACOS, ROAS, Organic vs Paid
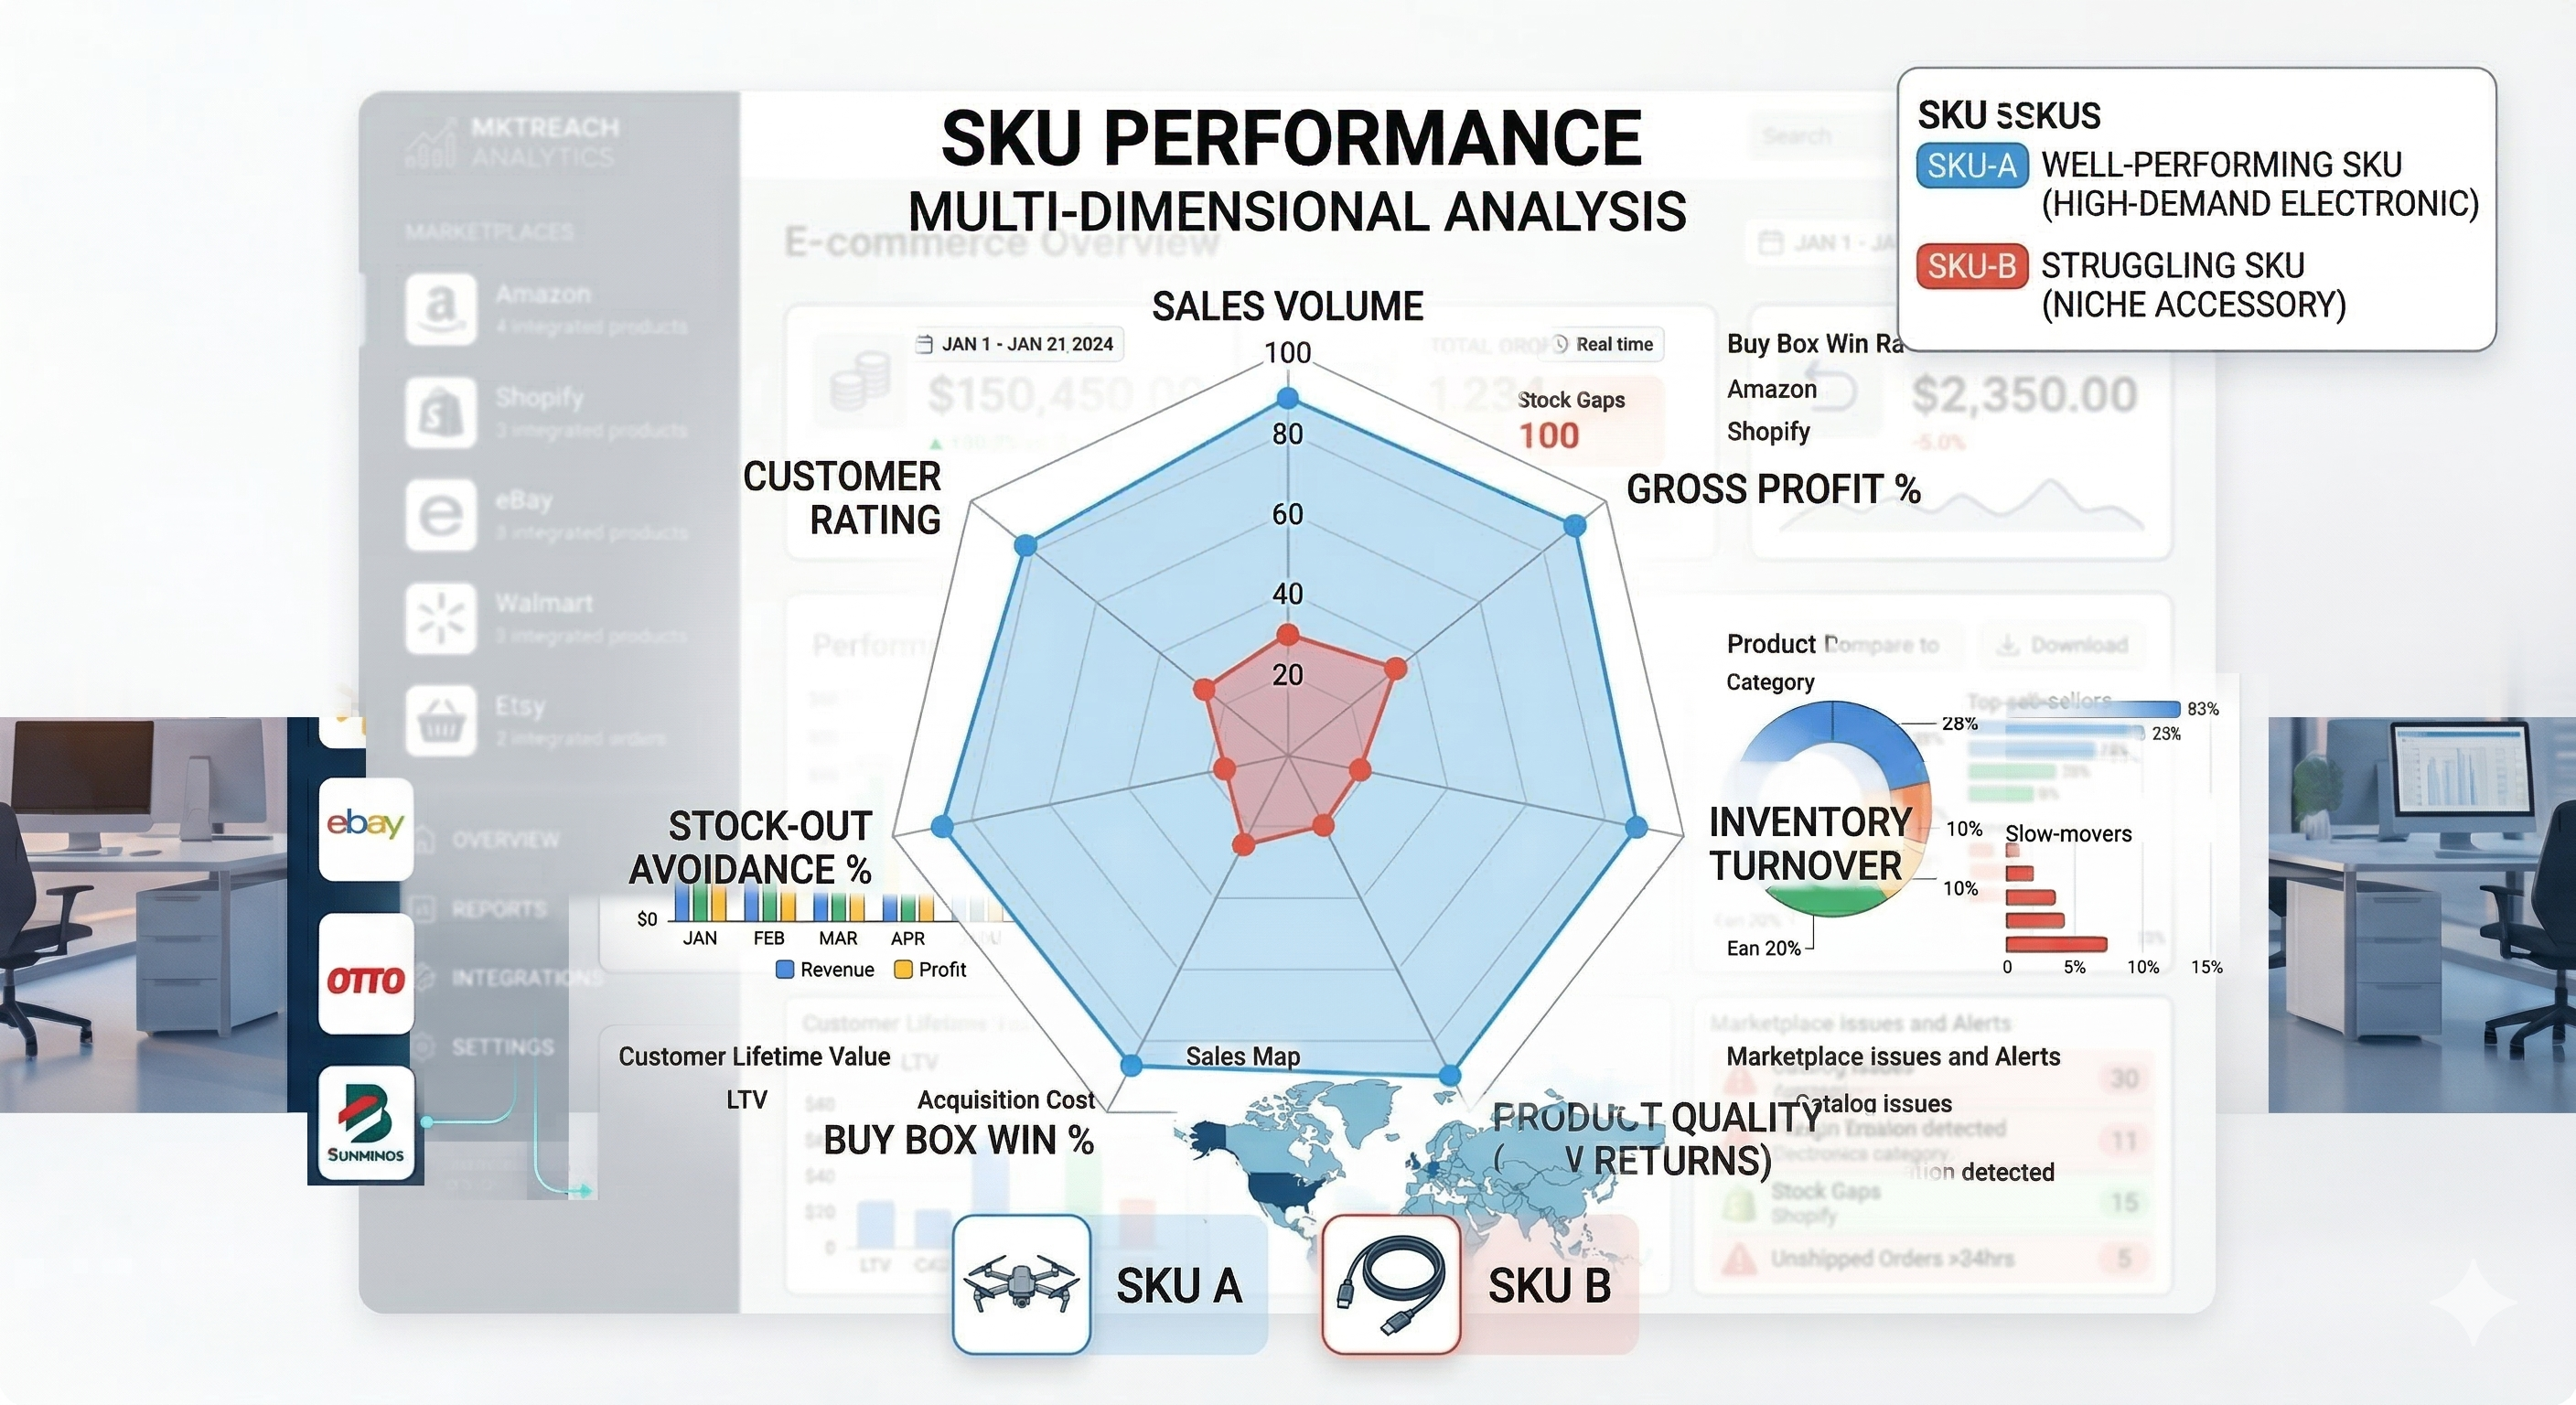
The system runs weekly comprehensive analysis with daily cost/price updates and 6-hour Buy Box tracking on focused products. When any dimension crosses a threshold — margin below 15%, Buy Box win rate below 25%, stock coverage under 60 days — a ticket is automatically created.
Rule-Based Marketing Automation
Instead of manually managing thousands of ad keywords and bid adjustments, we built a rules engine that evaluates performance data and takes automated action:
- 1Define rules — "If ACOS > 25% AND spend > €50 AND conversions = 0, then pause target"
- 2System evaluates — Continuously checks live advertising data against all active rules
- 3Action proposed — Matched rules generate action recommendations
- 4Human approval — Critical actions require team approval before execution
- 5Outcome tracked — The system measures whether the action improved performance
The engine supports sophisticated bid formulas, conflict resolution when multiple rules match the same target, and safety constraints (minimum bids, maximum changes per cycle).
Inventory Management & Sync
A unified inventory view across all warehouses and marketplaces with real-time stock level tracking, stock coverage calculation (days of inventory remaining based on sales velocity), bulk inventory upload with validation, aging analysis, and automatic alerts when stock drops below safety thresholds.
Shipment Management & DHL Integration
For European marketplaces, particularly Otto, we built DHL shipping label generation directly from the platform, shipment tracking with status sync back to the marketplace, fulfillment SLA monitoring with automatic alerts for unshipped orders, and direct fulfillment order management for Amazon DF orders.
Multi-Dimensional Cost Management
The platform tracks accurate costs per SKU per warehouse per currency per time period, accounting for purchase cost, shipping cost, vendor VAT rate, additional costs (insurance, customs), and cost validity periods. This makes every margin calculation accurate to the cent — something that was impossible with spreadsheets.
Operations Ticketing System
21 automated ticket types covering every category of e-commerce operational issue:
| Category | Ticket Types | Auto-Detection |
|---|---|---|
| Product Quality | Catalog issues, Missing SKU data, Missing product data | Continuous scan of listing quality scores |
| Competitive | Buy Box loss, AMS ranking checks | 6-hour monitoring cycle |
| Financial | Margin erosion, Missing SKU cost | Daily profitability analysis |
| Inventory | Stock coverage gaps, Stock not live, FBA health | Daily inventory health check |
| Fulfillment | Unshipped order warnings, Shipping labels | Real-time order monitoring |
| Marketing | ACOS/CTR deviations, Budget allocation, Rules matches | Continuous ad performance evaluation |
| Operations | Technical issues, Data upload approvals, General | On-demand |
Each ticket includes full context: which SKU, which marketplace, what's wrong, severity level, and suggested action. Tickets are grouped intelligently (by client, marketplace, and brand) with limits to prevent overwhelming the team.
The Numbers
Estimated Business Impact
| Metric | Before | After | Impact |
|---|---|---|---|
| Data Freshness | Days-old spreadsheets | Near real-time sync | From stale to live |
| Payment Reconciliation | ~15 hours/week manual | Fully automated | ~15 hours/week saved |
| Issue Detection | Reactive — found after damage | Proactive — 21 types auto-detected | Problems caught before they cost money |
| Inventory Visibility | Per-marketplace, often outdated | Unified, near real-time | Overselling virtually eliminated |
| Ad Optimization | Monthly manual review | Continuous rule-based evaluation | Wasted spend identified in hours, not months |
| Adding New Marketplace | Months of manual setup | Weeks (unified architecture) | Scalability unlocked |
| Profitability Calculation | Inaccurate (missing fees, returns, costs) | Accurate to the cent | Real margins visible for the first time |
| Reporting | Hours compiling per report | On-demand dashboards | Leadership gets answers in seconds |
Key Challenges We Overcame
Every Marketplace API Is Different
Amazon alone requires two separate APIs — the Selling Partner API for orders and products, and the Ads API for advertising data. Some data is only available through a request → poll → download workflow where you request a report, wait for it to generate, then download and parse it.
Otto requires DHL label generation with German shipping compliance rules. Bol.com has a unique settlement structure. Trendyol's inventory system requires polling. Each marketplace has different product identifiers (ASIN, EAN, item number, FSN, barcode, mp_sku_code) — mapping the same physical product across 9 different ID systems is a problem in itself.
Commission Structures Are Nightmarishly Complex
Every marketplace charges differently:
Getting this wrong means your profitability numbers are wrong — which means every business decision built on those numbers is wrong.
Multi-Currency Is More Than Conversion Rates
Operating in EUR, USD, TRY, AED, and AUD means:
- Costs are in one currency, revenue in another
- Commission rates are marketplace-currency specific
- Settlement payments arrive in local currency
- The same SKU might have different costs at different warehouses in different currencies
- Exchange rate fluctuations directly impact margin calculations
Technology Approach
We chose a modern, scalable architecture designed for continuous, reliable data processing:
Backend
Python-based API layer handling 530+ endpoints
Frontend
React-based responsive interface with 43+ operational pages
Database
PostgreSQL with 188 models for structured marketplace data
Background Processing
156 automated tasks for continuous data ingestion and analysis
Real-Time
Event streaming for instant Amazon order notifications
Multi-Tenant
Built from day one to support multiple clients with isolated data
Lessons Learned
Start with the data model.
Getting the unified representation right — making an Amazon order, an Otto order, and a Bol order look the same — was the hardest and most important decision we made.
Build for failure from day one.
Marketplace APIs go down, throttle requests, and return unexpected data. Every data pipeline needs automatic retries, gap detection, and error tracking.
Every marketplace lies about their API docs.
Real behavior always differs from documentation. Budget time for discovery and edge cases.
Automate detection, not just data collection.
Pulling data into a dashboard is useful. Automatically finding problems in that data and creating actionable tickets is transformational.
Domain expertise matters more than technical skills.
Understanding how e-commerce operations actually work — commission structures, fulfillment workflows, ad bidding strategies — was harder than writing the code.
What's Next
We continue to expand the platform with deeper analytics, predictive forecasting, additional marketplace integrations, and enhanced automation capabilities. The platform grows with the business — each new marketplace integration becomes faster because the unified architecture is already in place.
Technology
“Managing nine marketplaces felt like running nine separate businesses. Every decision required logging into a different portal, downloading a different report, and hoping the data was still current. Now it's all in one place.”
— Operations Lead, Dom Ventas